BNB (BNB/USDT) Pauses Bullish Momentum, Seeks to Hold Above Immediate Support Level
Estimated Reading Time: 3 minutes
Don’t invest unless you’re prepared to lose all the money you invest. This is a high-risk investment and you are unlikely to be protected if something goes wrong. Take 2 minutes to learn more
BNB Long-term Analysis: Ranging
The market for BNB against the Tether has seen a slight downward movement after the previous session’s gains. As it stands, the price is positioned within the lower segment of the Bollinger bands, indicating a consolidation period as the price struggles to hold above the $559 critical level.
Recently, the pair oscillated within the upper limit of the Bollinger bands. However, the current price actions show the pair experiencing a dip, as the momentum oscillator beneath the chart indicates a potential pause in the upward shift in price.
To this end, BNB trades at $594.41, recording a 1.29% loss and 124.91 thousand volumes for the week already.
Technical Indicators
Major Resistance Levels: $652.03, $744.74, and $800.00
Major Support Levels: $559.31, $500.00, and $450.00
BNB Technical Analysis
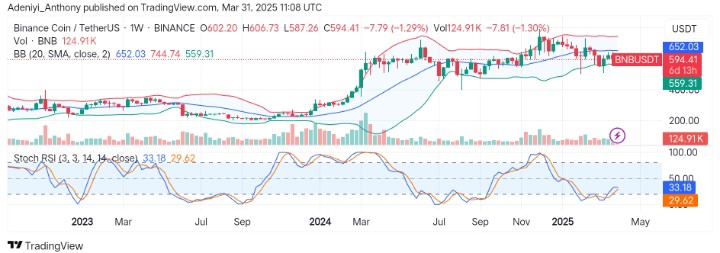
The analysis of BNB against the Tether on a weekly chart shows the pair’s market sentiment is still neutral despite the losses recorded. However, the price position between the lower Bollinger bands suggests the pair is beginning to face pressure from the bears, aiming toward the $559.31 immediate support level.
On the other hand, the Stochastic RSI signals a momentary pause in momentum as the lines prepare for a bearish crossover.
To this end, a spike in trading volume would determine the next direction. However, the pair’s target is locked on the lower band at $559, suggesting the price may move southwards for a while before building momentum towards the mid-band at $652.
BNB/USDT Analysis: What’s Next?
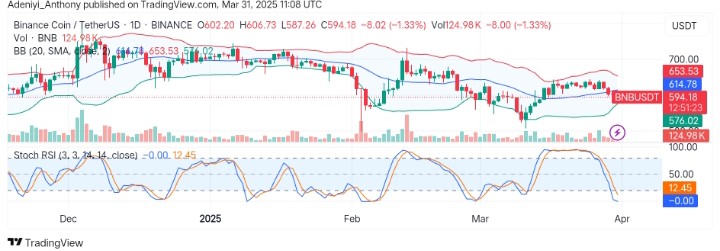
On the daily timeframe, the analysis for BNB/USDT is showing a mixed sentiment. The price actions around the Bollinger bands indicate a bearish movement as the price breaks below the mid-line. However, the momentum oscillator suggests a potential rebound in the near term if buyers step in as the lines signal a pause in the current momentum.
To this end, if buyers could defend the $576 zone, a rebound toward the $614.78 dynamic line would be possible; otherwise, the price may consolidate for a while before another major directional movement.
You can purchase crypto coins here. Buy LBlock