BNB (BNB/USDT) Prepares for More Potential Upside Gains
Estimated Reading Time: 2 minutes
Don’t invest unless you’re prepared to lose all the money you invest. This is a high-risk investment and you are unlikely to be protected if something goes wrong. Take 2 minutes to learn more
BNB Long-term Analysis: Bullish
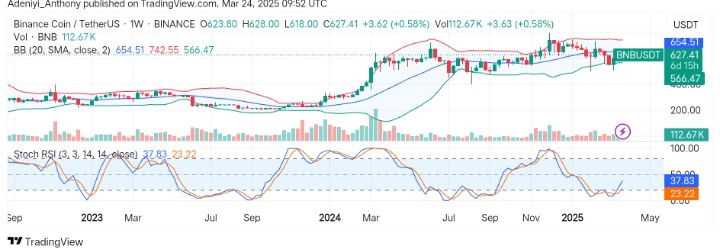
Over time, the market for BNB against the Tether has been moving within a narrow space, between tight Bollinger bands. However, in recent times, the pair have been recording some positive gains as the BNB prepares for another upside momentum.
To this end, the pair aims at the $654.49 mid-line of the Bollinger bands as it gains traction.
Currently, BNB trades at $627.41, recording over a hundred traded volumes on the first day of the week.
Technical Indicators
Major Resistance Levels: $654.51, $700.00, and $750.00
Major Support Levels: $600.00, $566.46, $500.00
BNB Technical Analysis
The analysis for BNB against the Tether on a weekly chart has shown that the air is set to record more gains, moving close to the mid-band level at $654.51 as the band shows signs of expansion.
On the other hand, the oscillator beneath the chart shows that the pair is leaving the oversold region, with the lines pointing upward, heading toward the 50-mark level.
To this end, a break above the dynamic line of the Bollinger bands would indicate a trajectory toward the higher limit at $742.55.
On the contrary, a break below $600 critical support would signal a short-term pullback.
BNB/USDT Analysis: What’s Next?
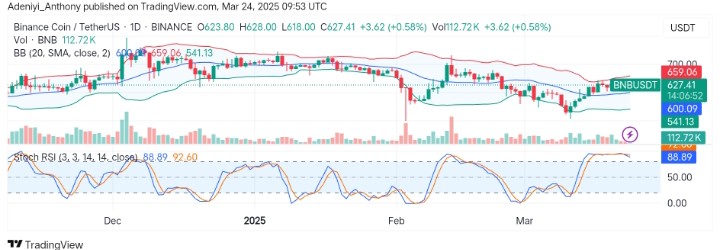
On the daily timeframe, BNB/USDT appears to be losing momentum as it trades near the $659.06 upper limit of the bands. However, the current price movement within the upper segment of the Bollinger bands suggests a pause as the pair prepares for a breakout.
The Stochastic RSI, on the other hand, shows that the pair operates deep in the overbought region. Therefore, the price may experience a short-term pullback before regaining upside traction.
To this end, BNB/USDT needs to break above $600 for a bullish re-entry opportunity for the bulls; otherwise, a break below this level would signal more dip towards the south.
You can purchase crypto coins here. Buy LBlock