Bitcoin (BTC/USD) Price May Hold a Base Near $22,500
Estimated Reading Time: 3 minutes
Don’t invest unless you’re prepared to lose all the money you invest. This is a high-risk investment and you are unlikely to be protected if something goes wrong. Take 2 minutes to learn more
Bitcoin Price Prediction – February 8
From the technical point of view, in the long-term run of the BTC/USD market operations, the crypto-economic price appears to hold a base near the $22,500 line. Buying and selling transactions have zoned between the high and the low points of $23,434.98 and $23,061.35, keeping a minute negative percentage rate of 0.67. that connotes that a reduction-moving style is relatively ongoing as of the time of compiling this write-up sentiment.
BTC/USD Market
Key Levels:
Resistance levels: $25,000, $26,000, $27,000
Support levels: $21,000, $20,000, $19,000
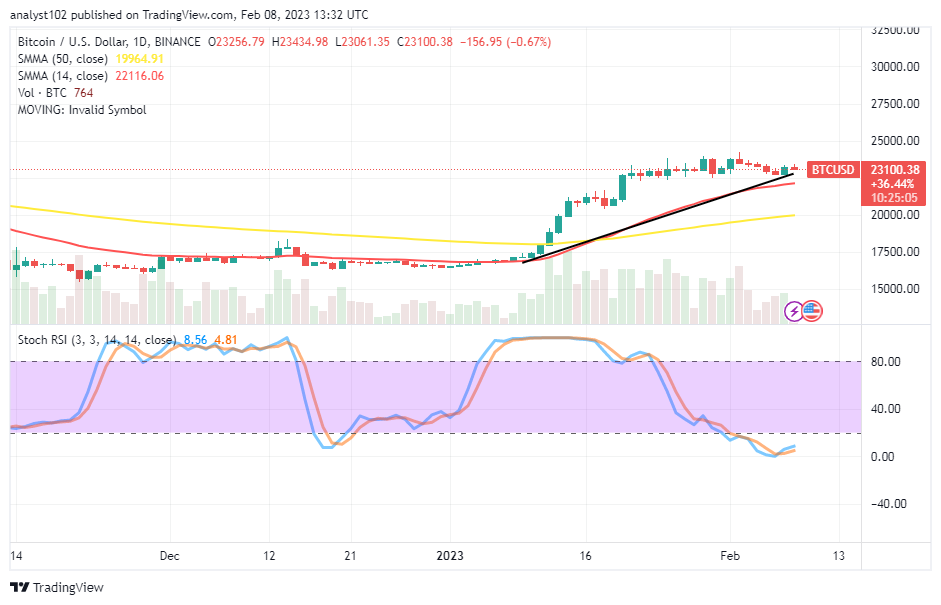
BTC/USD – Daily Chart
The reading on the BTC/USD daily chart showcases the crypto-economic price attempts to hold its base near the $22,500 psychological level. That point currently serves as the critical baseline. The bullish trend line has drawn northward to touch it from below. The 14-day SMA indicator is $22,116.06 higher than the 50-day SMA indicator’s value line of $19,964.91. The Stochastic Oscillators have moved south into the oversold region, with the blue line at 8.56 and the red line at 4.81, indicating that the price is attempting to make an upswing to the upside.
What is the current strength in the Bitcoin/USD market concerning a clear direction?
It appears that the BTC/USD market strength would hold a base near the $22,500 level to find support. Long-position placers must maintain a status of longing position orders as the Stochastic Oscillators have suggested an oversold condition outlook as a bullish candlestick tends to swing upward from an active falling force from around the point mentioned earlier or a bit lower to it.
On the southward-moving side of the BTC/USD market technical, Bears would have to consolidate their stances between the points of $25,000 and $22,500 in an antagonizing manner to any barrier-breaking force that buyers may tend to put up with afterward. An eventual production of a bearish-engulfing candlestick against the 14-day SMA trend line will let there be a downward trend resumption process.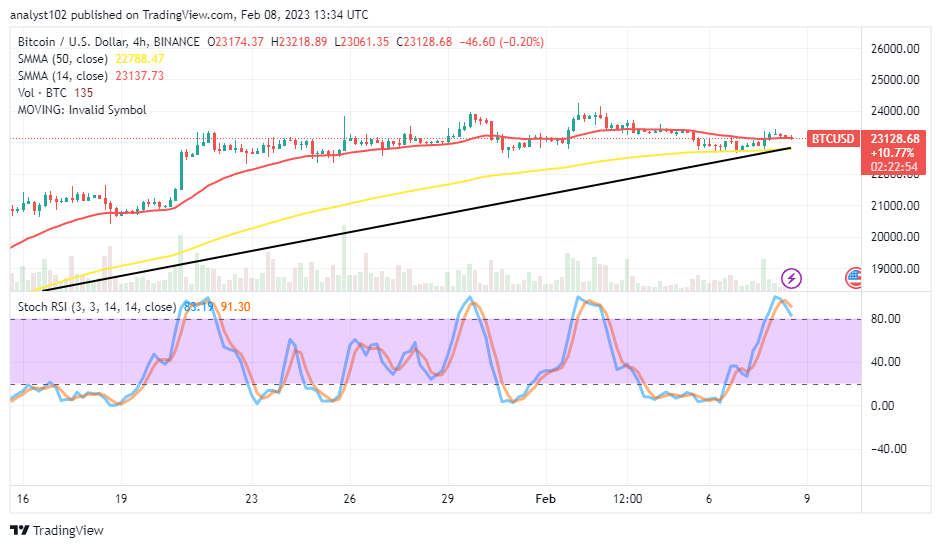
BTC/USD 4-hour Chart
The medium-term chart of the BTC/USD mirrors that the crypto-economic price may hold a base near the $20,000 support level if the bigger SMA trend line refuses to breach fearfully southward. The 14-day SMA indicator is at $23,137.73 over the $22,788.47 value line of the 50-day SMA indicator. There has been a series of 4-hour trading candlesticks around $23,000, close to the value of $24,000, indicating a range-moving pattern. At 91.30 and 83.19, the Stochastic Oscillators are in the overbought zone. That implies that some falls may occur before receiving assistance.
Note: Cryptosignals.org is not a financial advisor. Do your research before investing your funds in any financial asset or presented product or event. We are not responsible for your investing results.
You can purchase Lucky Block here. Buy LBLOCK