BNB (BNB/USDT) Poised for a Recovery Above $700
Estimated Reading Time: 3 minutes
Don’t invest unless you’re prepared to lose all the money you invest. This is a high-risk investment and you are unlikely to be protected if something goes wrong. Take 2 minutes to learn more
BNB Long-term Analysis: Bullish
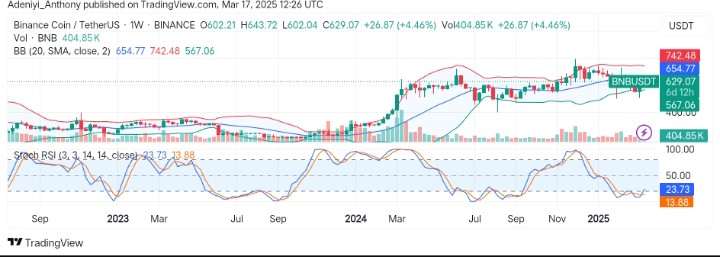
The market for BNB against the Tether in recent times has been oscillating within a close range, bouncing around a tightened Bollinger band. This is seen in the way the pair had been moving without a clear direction.
However, bullish traders in the market are beginning to change the narrative, as the price holds above the $567 lower band for a move towards the $700 psychological level. This move looks promising as the Stochastic RSI shows bullish momentum is building up, but caution is warranted due to the placement of the lines in the oversold region.
Currently, BNB trades at $629.07, recording over 4% gains with 404.85 thousand volumes already.
Technical Indicators
Major Resistance Levels: $654.77, $700.00, and $742.48
Major Support Levels: $600.00, $567.06, and $500.00
BNB Technical Analysis
The analysis for BNB against the Tether on a weekly timeframe shows that the pair is gearing up for more upside momentum. However, recent price actions below the mid-band suggest BNB/USDT is recovering after a significant sell-off in previous weeks.
On the other hand, the Stochastic RSI indicates more price improvements might be recorded in coming trading sessions as lines point to the North.
To this end, the pair needs to break above the immediate resistance at the mid-band level for a confirmed price action above the psychological level.
BNB/USDT Analysis: What to Expect
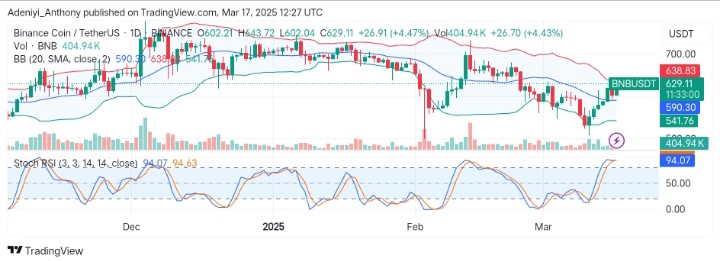
On the daily timeframe, BNB/USDT is moving aggressively to the north. However, current price action around the upper bound shows that the pair faces resistance at that level.
Also, at the bottom of the chart, the oscillator signals bullish momentum may be waning as the lines stretch forward in an extremely overbought condition. This indicates there might be a pause in the current move as the immediate resistance is yet to be broken.
To this end, a retracement below the $600 level would suggest a movement back to the initial position. Conversely, a break above $638.83 might stimulate a move toward the $700 psychological level.
You can purchase crypto coins here. Buy LBlock