BNB (BNB/USDT) Shows Strength Above $1,000 as it Extends Upwards
Estimated Reading Time: 3 minutes
Don’t invest unless you’re prepared to lose all the money you invest. This is a high-risk investment and you are unlikely to be protected if something goes wrong. Take 2 minutes to learn more

The market for BNB against Tether has risen by 2.04% to over $1,000 in the last 24h, outperforming Bitcoin’s 1.75% and ETH’s 7.8% rebounds. As it stands, Trump’s dividend macro policy shifts and rising BNB DeFi metrics are the major propellants of the network.
Currently, BNB trades at $1,005.46 with over 127 thousand traded volumes and an overall bullish outlook as indicated by the daily stochastic oscillator.
Technical Indicators
Major Resistance Levels: $1,019.56, $1,056.26, and $1,120.00
Major Support Levels: $996,63, $978.91, and $824.98
Technical Analysis
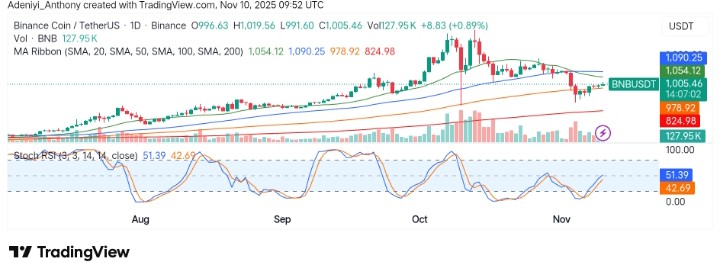
Technically, BNB against Tether has been displaying strength, advancing above $1,000 despite recent volatility. At the moment, the pair appear to be struggling to hold above 100-period simple moving average. Meanwhile, the Stochastic RSI points to continued bullish movement though current participation level seems to be low.
As it stands, the pair is recording slight gains and strength after opening around $996 for the day; more bullish strength is needed to maintain this structure as a break below this level may indicate the continuation of recent bearish action.
The bounce on the $BNB chart might be complete. Wave (5) looks quite weak, however. It is important to stay flexible here. Either way, there is no sign that the larger wave 4 pullback is complete. The overall uptrend remains intact on the larger timeframe. https://t.co/QirU2dG9op pic.twitter.com/AVl78SaiqV
— More Crypto Online (@Morecryptoonl) November 2, 2025
However, @Morecryptoonline has raised a suggestion on flexibility, reiterating that previous wave may still be ongoing and micro resistance is still beyond current level.
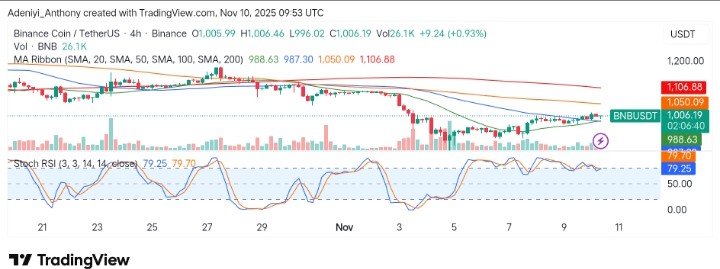
BNB/USDT Analysis: Breakout or Breakdown: What’s Next?
On the 4h timeframe, BNB/USDT appears to be exhibiting a complicated structure, the price seems to be bending to the will of a resistance around $1,006 above the short-period moving averages. Additionally, the Stochastic RSI seems to be making visible the intricacy of the situation as the lines show no specific pattern around the overbought region. This shows the pair need more participation to have a well-defined trend.
To this end, the pair will be able to maintain the current trend if bullish strength increases but momentarily, the bears are in control in the short-run and a break below $1,000 will pull the price back into the $900 zone.
You can purchase crypto coins here. Buy Crypto