BNB (BNB/USDT) Faces Significant Pullback Amid Broader Market Weakness
Estimated Reading Time: 3 minutes
Don’t invest unless you’re prepared to lose all the money you invest. This is a high-risk investment and you are unlikely to be protected if something goes wrong. Take 2 minutes to learn more
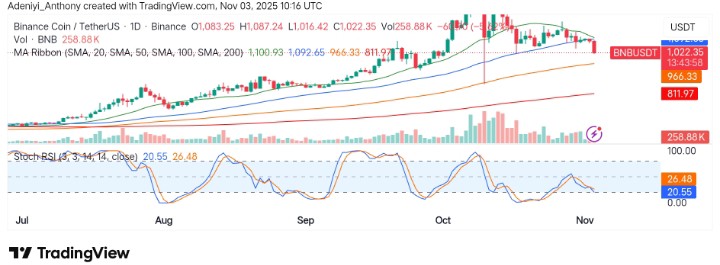
In the past 24 hours, BNB against Tether has seen a decline of around 6.24%, going below the broader crypto market depth, as the drop aligns with a 7-day decline of about 11.31%. This appears to be driven by a recent $470 million market-wide sell-off and mixed signals regarding the CZ controversy, as well as a drop below the 78.6% ($1,049) retracement level.
As it stands, the pair happens to be gearing for more correction as the price points downward with increasing volumes at the beginning of the week.
Currently, BNB trades at $1,022.35 with more than 258 thousand volumes for the day
Technical Indicators
Major Resistance Levels: $1,080, $1,105, and $1,150
Major Support Levels: $1,000, $950, and $811
Technical Analysis
Technically, BNB against Tether has been facing stronger bearish pressure in the previous days. This showcases a reject at higher resistance levels, leading to a drop in the price after the formation of an all-time high.
As it stands, it appears that the price has failed to form another high after breaking above $1,100 in recent times, with the momentum dropping back into the 900 zone. Meanwhile, it appears that a rebound may be possible at any time soon, as the Stochastic RSI enters the oversold region.
To this end, the trend is still bullish, but the threat from the recent sell-off might pull the price back into the nearest support zone.
BNB Hopes for a Major Breakout
Technically, BNB on a larger timeframe has stretched extensively. However, it appears that there might be a move to the upside based on the microstructure and the location of the support levels on the weekly chart.
As it stands, though the token appears to be doing better, outperforming Bitcoin in every cycle, it holds potential for a low as the price faces bearish impact with a trajectory towards the $940 support level.
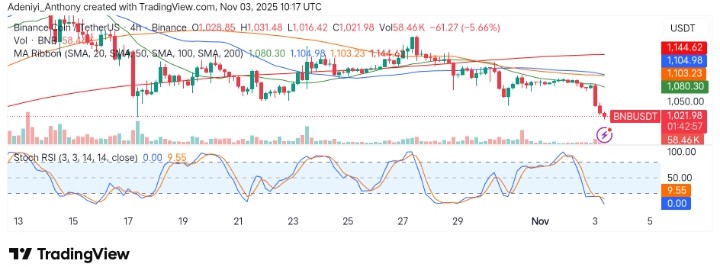
BNB/USDT Analysis: Correction Continues as Price Holds Below Critical Levels
On the 4-hour chart, BNB/USDT appears to be showing continued bear pressure as the price extends to the south. At the moment, the price has distanced itself below the moving average cluster. Additionally, the momentum oscillator suggests further bearish action as the lines extend into the oversold region.
To this end, the $1,000 acts as a psychological support level, but a break below the $950 level would suggest a move towards $800.
You can purchase crypto coins here. Buy Crypto