Ripple Is in a Range, but May Fall as Low as $0.37
Estimated Reading Time: 2 minutes
Don’t invest unless you’re prepared to lose all the money you invest. This is a high-risk investment and you are unlikely to be protected if something goes wrong. Take 2 minutes to learn more
Ripple (XRP) Long-Term Analysis: Bearish
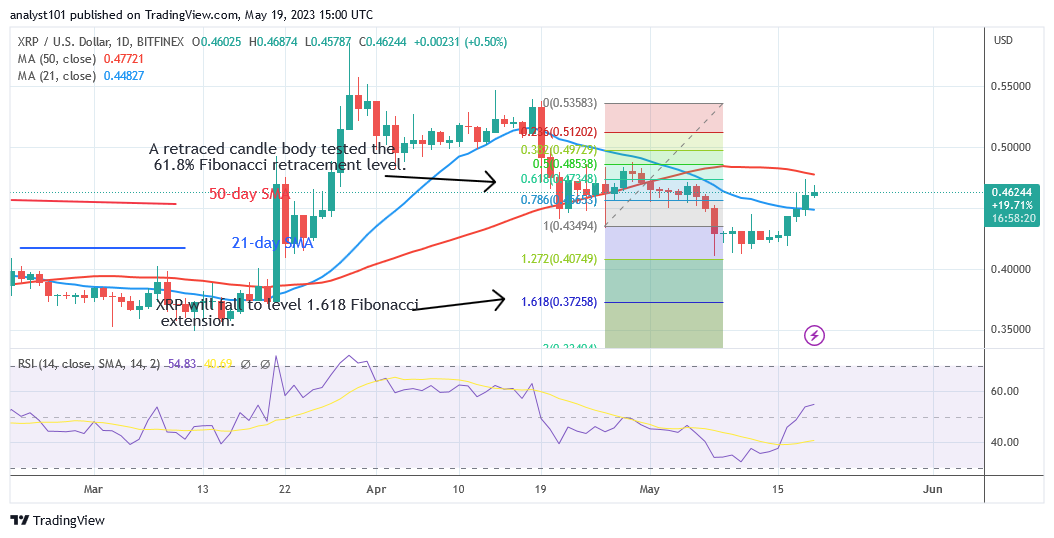
Ripple (XRP) is now stuck between the moving average lines but may fall as low as $0.37. The 50-day SMA rejected the rising movement. The cryptocurrency is currently trapped in between the moving average lines. When the moving average lines are crossed, XRP will trend. If the 50-day SMA is broken, XRP will resume its upward trend. The altcoin will regain its $0.55 peak. However, the cryptocurrency will stay entrapped where the moving average lines are unbroken. On the other hand, there is a significant chance that the price will drop to the bearish trend zone if the bears breach below the 21-day SMA.
Technical Analysis
Major Resistance Levels – $2.00, $2.50, $3.00
Major Support Levels – $1.50, $1.00, $0.50
Ripple (XRP) Indicator Analysis
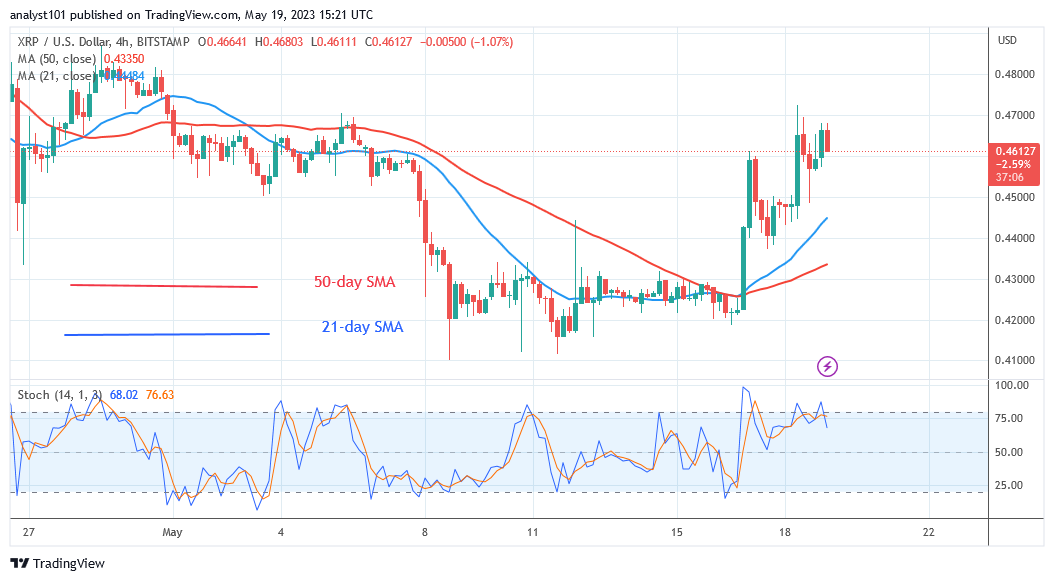
On the Relative Strength Index for period 14, Ripple is at level 54. XRP is stalled below the 50-day SMA but will increase in the uptrend zone. Due to its position between the moving average lines, the cryptocurrency asset will start to move in a range. Above the daily Stochastic level 75, XRP has a positive momentum.
What Is the Next Direction for Ripple (XRP)?
XRP has reached the overbought region of the market but may fall as low as $0.37. The altcoin has retraced in between the moving average lines. The assumption is that the moving average lines will limit the price movement. In other words, XRP will once more trade in a range for a few days.
You can purchase crypto coins here. Buy LBLOCK
Note: Cryptosignals.org is not a financial advisor. Do your research before investing your funds in any financial asset or presented product or event. We are not responsible for your investing results