Ripple Continues in a Range, but Risks Decline below $0.38
Estimated Reading Time: 2 minutes
Don’t invest unless you’re prepared to lose all the money you invest. This is a high-risk investment and you are unlikely to be protected if something goes wrong. Take 2 minutes to learn more
Ripple (XRP) Long-Term Analysis: Bearish
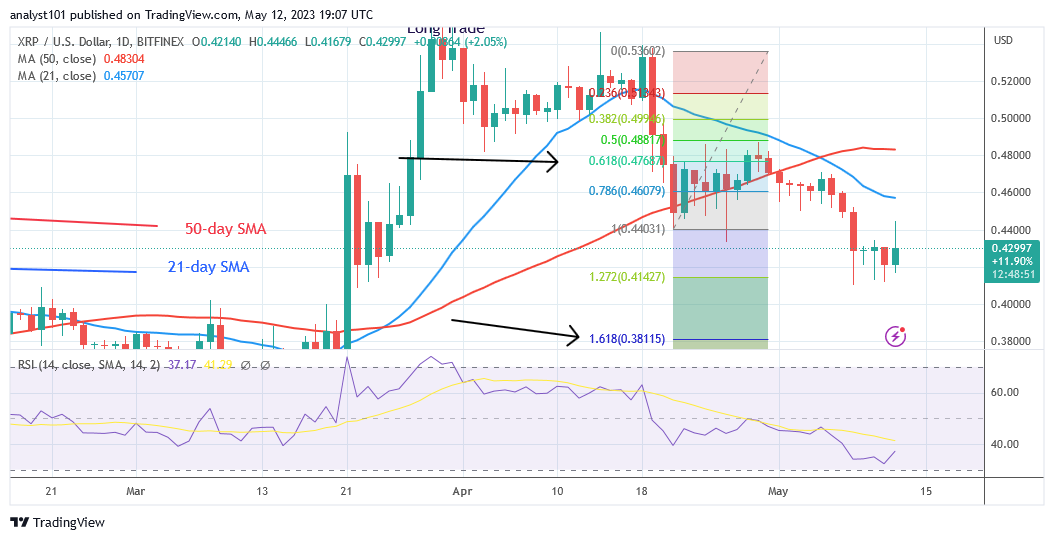
Ripple (XRP) has fallen to a low of $0.41 but risks decline below $0.38. Ripple has been ranging between the $0.44 high and the $0.41 support. These range-bound levels have been holding steady over the previous week. According to all signs, XRP will be compelled to continue its downward trend. Once the $0.41 support is broken, XRP will once again come under selling pressure. Meanwhile, XRP underwent an upward corrective following the April 21 price decline, and a candle body tested the 61.8% Fibonacci retracement level. According to the correction, XRP will drop to the $0.38 low or level 1.618 Fibonacci extension. According to price movement, the altcoin has only been available between $0.41 and $0.44. XRP is currently trading above the existing support.
Ripple (XRP) Indicator Analysis
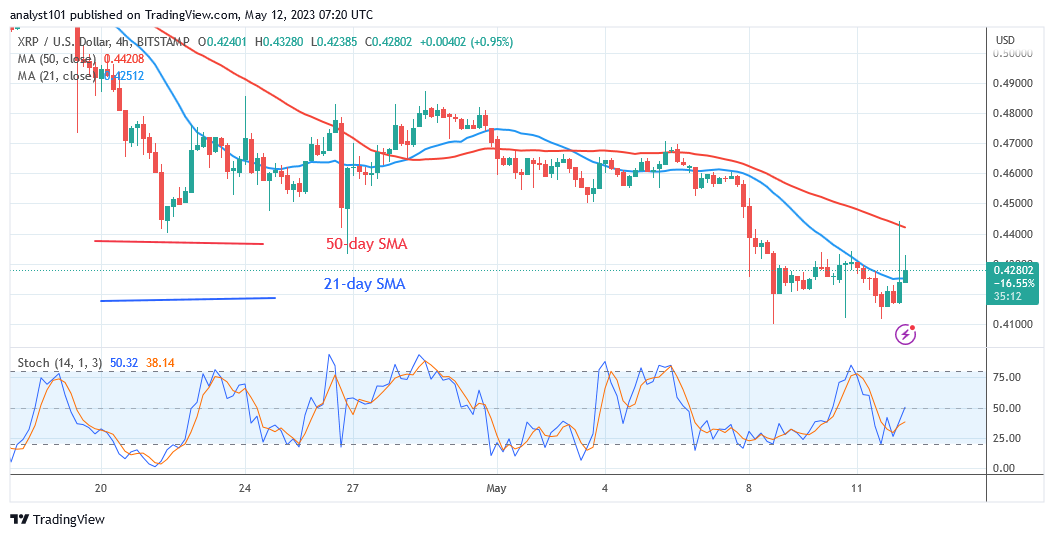
On the Relative Strength Index, Ripple is at level 36 for period 14. The Doji candlesticks have caused the RSI to remain unchanged. Further selling pressure is indicated by the price bars’ position beneath the moving average lines.Above the daily Stochastic level 40, XRP has a positive momentum.
Technical Analysis
Major Resistance Levels – $2.00, $2.50, $3.00
Major Support Levels – $1.50, $1.00, $0.50
What Is the Next Direction for Ripple (XRP)?
Ripple has broken above the 21-day SMA but risks decline below $0.38. The altcoin is caught in the moving average lines. It follows that XRP will keep moving in a range for a few more days.
You can purchase crypto coins here. Buy LBLOCK
Note: Cryptosignals.org is not a financial advisor. Do your research before investing your funds in any financial asset or presented product or event. We are not responsible for your investing results