Bitcoin (BTC/USD) Market Goes Lower, Visiting the $37,500
Estimated Reading Time: 3 minutes
Don’t invest unless you’re prepared to lose all the money you invest. This is a high-risk investment and you are unlikely to be protected if something goes wrong. Take 2 minutes to learn more

Free Crypto Signals Channel
Bitcoin Price Prediction – May 1
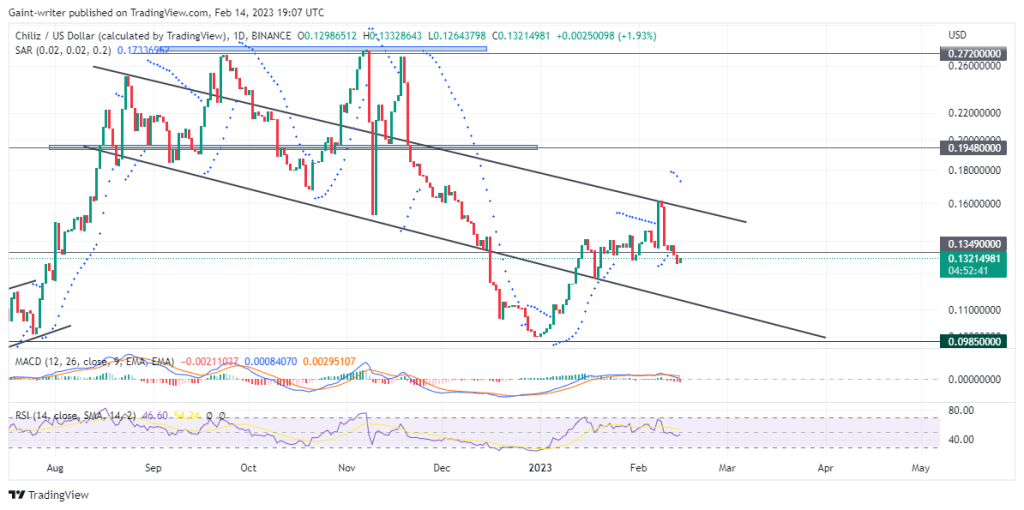
The BTC/USD market goes lower, visiting the $37,500 support trading line. Presently, the price is trading around $38,025 within the lesser-space difference of high-and-low value lines at a minimal positive percentage rate of 0.76.
BTC/USD Market
Key Levels
Resistance levels: $40,000, $42,500, $45,000
Support levels: $37,500, $35,000, $32,500
BTC/USD – Daily Chart
The BTC/USD daily chart shows the crypto-economic market goes lower, visiting the $37,500 support trading level. The base trading instrument struggles to recover against the US Dollar around the value line. The 14-day SMA trend line has briefly extended southward underneath the 50-day SMA trend line closely above the $40,000 resistance. The Stochastic Oscillators have crossed their cross southbound from the range of 40 closer to the 20 range line.
Will it be the best time to start longing for new positions in the BTC/USD trade as the crypto-economic market goes lower, visiting the $37,500?
It appears one of the best times to start longing for new positions as the BTC/USD market goes lower, visiting the $37,500 serving as the critical support trading level of the crypto business operations over time. However, the situation may still experience some falling forces around the value line for a while to allow the price to solidify its stance around the value line. It would be of a better technical deal to have an emergence of a bullish candlestick, having its bottom shadow spanning from a depth below the critical support point to signify a return of stable ups in the following sessions while that plays out.
On the downside of the technical analysis, the BTC/USD market short position takers may have to let some formerly positions open at a higher trading zone to run into a profiteering motion beneath the $37,500 support level. Bears’ forces, at this point, may not be said to have lacked the capacity strength to push the crypto economy’s valuation lowers to a lower support line of $35,000 in the long-term run.
BTC/USD 4-hour Chart
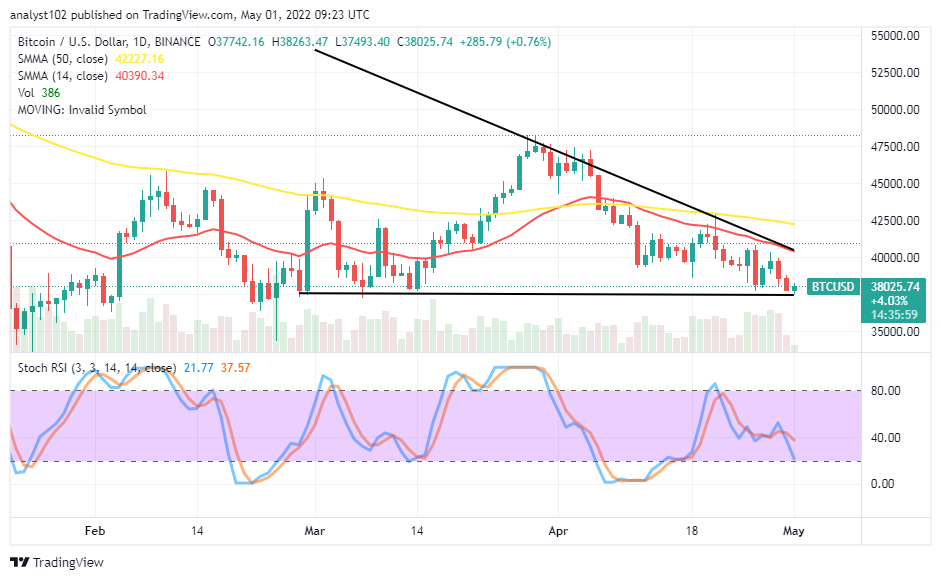
The BTC/USD medium-term chart shows the crypto-economic market goes lower, visiting the $37,500 support level. The 14-day SMA indicator is underneath the 50-day SMA indicator. The breaking down of the value-line may potentially erase the descending triangular pattern that the market maintains over off the chart for a while. The Stochastic Oscillators are seemingly swinging around the range of 20 to signify some erratic ups and downs are ongoing. Traders needed to be on the lookout for upward bounces to launch buying orders.
Note: Cryptosignals.org is not a financial advisor. Do your research before investing your funds in any financial asset or presented product or event. We are not responsible for your investing results.
You can purchase Lucky Block here. Buy LBlock: