BNB (BNB/USDT) Settles Above $651 Dynamic Level for an Upside Push
Estimated Reading Time: 3 minutes
Don’t invest unless you’re prepared to lose all the money you invest. This is a high-risk investment and you are unlikely to be protected if something goes wrong. Take 2 minutes to learn more
BNB Long-term Analysis: Bullish
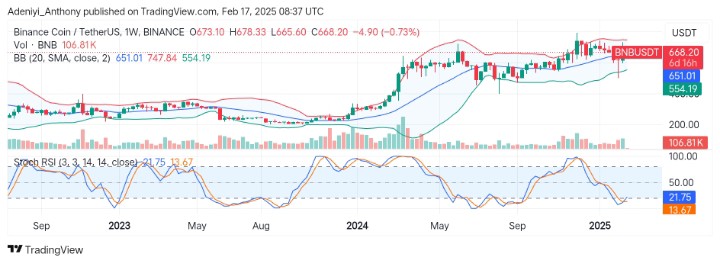
BNB against the Tether on the weekly timeframe appears to be preparing for a northbound journey as the pair’s price hit above the mid-Bollinger band, indicating a potential trend continuation despite the current struggle for market dominance.
Recently, BNB has experienced a pullback towards the dynamic mid-band with a suspended wick hitting below the lower band. However, current price action at the start of the week pictures an upside movement ahead, as the Stochastic oscillator shows signs of recovery.
Currently, BNB trades at $668.20 with a marginal loss of 0.78% and over 100 traded volumes for the week.
Technical Indicators
Major Resistance Levels: $685, $710, and $760
Major Support Levels: $650, $600, and $560
BNB Technical Analysis
The analysis of BNB against the Tether on the weekly timeframe shows that the price is testing the mid-band level after a noticeable bullish effort last week. The price actions around the $651 dynamic level show that the price awaits more bullish participation to rally toward the upper band at $747.84 despite current pressure.
On the other hand, the Stochastic RSI suggests the start of a new upward momentum as the lines signal a bullish breakout, hinting at a potential rebound ahead.
To this end, the price needs to break above the $685 level to move towards the upper limit, as a break below the $650 level would push the price to the south.
BNB/USDT Analysis: Where from Here?
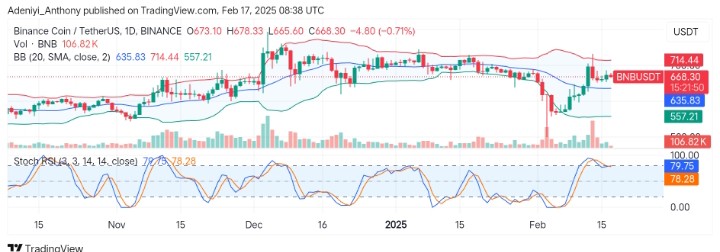
On the daily timeframe, BNB/USDT appears to be in an overbought condition with the price hovering between two important levels. Also, the Stochastic RSI signals a very near overbought condition for the pair; despite the appearance of the blue line on top of the orange line, a slight retracement may be expected before a further uptrend in the near term.
To this end, the price needs to break above $685 for a bullish continuation; otherwise, a retracement below $635 would indicate a toward $600 or lower support levels.
You can purchase crypto coins here. Buy LBlock