BNB (BNB/USDT) at a Turning Point: What is Next?
Estimated Reading Time: 3 minutes
Don’t invest unless you’re prepared to lose all the money you invest. This is a high-risk investment and you are unlikely to be protected if something goes wrong. Take 2 minutes to learn more
BNB Long-term Analysis: Bullish
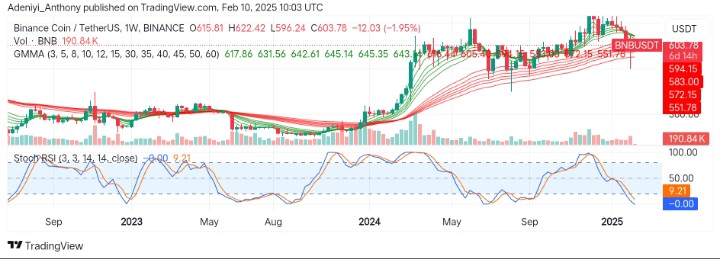
BNB, the native coin of Binance against the Tether (USDT), is currently oscillating above the $600 critical level after experiencing a steady drop in price in previous trades. However, the pair have enjoyed a quick rally to the top at the beginning of the year, but is now at a critical point, waiting for increased bullish participants as the oscillator beneath the weekly chart points to an oversold condition.
Recently, BNB has been hovering between a space left aside by the Guppy Multiple Moving Averages (GMMAs). This suggests low pressure from participants, as shown by the amount of traded volumes.
Currently, BNB is trading at $603.78, down by 1.95%, with over 190 thousand traded volumes.
Technical Indicators
Major Resistance Levels: $605, $617, and $645
Major Support Levels: $583, $572, and $550
BNB Technical Analysis
The analysis of BNB against the Tether shows that the pair is currently consolidating after retracing from $650, last week’s high. The compressed GMMAs suggest more decline may occur as the short-period EMAs converge towards the long-period EMAs from above, indicating a bearish crossover.
On the other hand, the Stochastic RSI signals an extremely oversold condition, with one of the lines reading a 0.00 value. This may indicate the selling pressure is beginning to wane, and the price may retest the $605 resistance soon.
To this end, an improvement in the values of the lines would signal a reversal; otherwise, a move toward $583 is possible.
BNB/USDT Analysis: Expectations
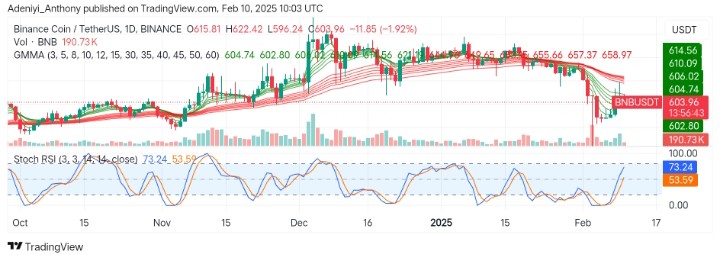
On the daily timeframe, BNB/USDT has seen a sharp fall in price. However, the price behavior seems to be showing signs of attempting a recovery. This suggests a renewed buying interest as the shorter-period EMAs move closer to the longer-period EMAs despite the current dip.
On the other hand, the Stochastic indicator suggests a short-term recovery as lines show signs of potential extension into the overbought zone.
To this end, the price needs to reach the $614.56 level for a confirmed bullish reversal; otherwise, a further price drop is imminent.
You can purchase crypto coins here. Buy LBlock