Polkadot (DOT/USDT) Shows Signs of Upside Movement Despite Market Condition
Estimated Reading Time: 3 minutes
Don’t invest unless you’re prepared to lose all the money you invest. This is a high-risk investment and you are unlikely to be protected if something goes wrong. Take 2 minutes to learn more

Polkadot Long-term Analysis: Bearish
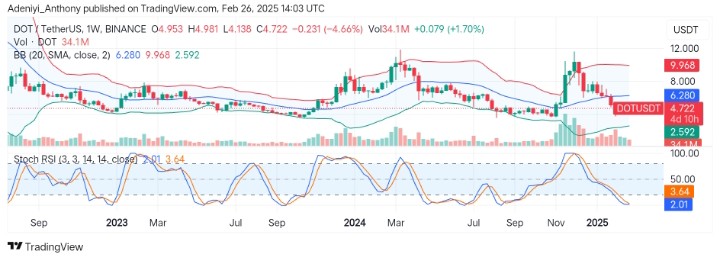
Polkadot against the Tether on a weekly timeframe has gone through a different type of cycle over the previous weeks. However, after peaking at $10.000, the pair has gone through a corrective decline, retracing beyond the critical level of $5.000.
Recently, the pair’s price traded below the mid-Bollinger band, suggesting the Polkadot is still in a corrective phase. However, the positioning of the Stochastic RSI indicates the pair may see an upside reversal in the near term.
Currently, Polkadot is trading at $4.722, recording a loss of over 4%, with a moderate 34.1 million traded volumes for the week.
Technical Indicators
Major Resistance Levels: $6.280, $8.000, and $10.000
Major Support Level: $4.130, $2.592, and $2.000
Polkadot Technical Analysis
The weekly analysis of Polkadot against the Tether shows that the pair seeks to rally when it finds support near its key level. However, the price actions below the 20-SMA line suggest an oversold condition, but a move above the $6.280 would signal that a reversal to the peak could be coming soon.
On the other hand, the Stochastic RSI, which operates below the 10-mark level indicates an extreme oversold condition for the pair. However, the slight curvature of the lines may signal the price is about to take a U-turn providing enough bullish traders flood the market.
To this end, polkadot may see a trend reversal if bullish traders can push the price above the middle band; otherwise, the price may see a further downtrend if support at $4.130 fails to hold.
DOT/USDT Analysis: Positioning for an Upside Reversal
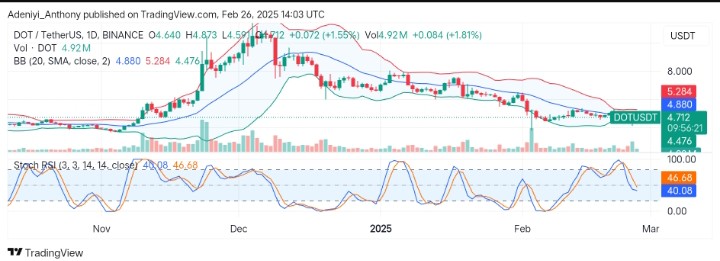
On the daily timeframe, DOT/USDT is currently showing early signs of potential short-term recovery after a prolonged downtrend. The price seems to be hovering just the mid-Bollinger band at $4.880. However, the contracted bands suggest increase activities in the near term.
The Stochastic RSI on the other, indicates the pair is neither oversold nor overbought. However, an upside crossover of the lines could signal a renewed bullish momentum.
To this end, a confirmed breakout above $4.880 could push DOT towards the upper band at $5.280; otherwise, a rejection might send it back to immediate support.
You can purchase crypto coins here. Buy LBlock