Metis DAO (METIS/USD): Bulls Challenge $25 Resistance Amid Rising Volatility
Estimated Reading Time: 3 minutes
Don’t invest unless you’re prepared to lose all the money you invest. This is a high-risk investment and you are unlikely to be protected if something goes wrong. Take 2 minutes to learn more
The Metis DAO (METIS/USD) market has shown notable strength in recent sessions, with buyers demonstrating determination as they push toward the critical $25 resistance level.
Following an extended consolidation around the $14 price area, bullish momentum gained traction, forcing bears to retreat and regroup near the $25 mark. This strong upward movement triggered heightened volatility, further intensifying the market struggle at this key resistance zone.
As price action approaches $25, technical indicators reveal a significant clash in market sentiment. Despite this, bulls appear to be holding their ground, maintaining pressure on the resistance even within traditionally bearish territory.
If bullish resilience continues, a breakout above $25 could pave the way for a new upward leg in the METIS/USD market.
Metis DAO Market Data
- METIS/USD Price Now: $24
- METIS/USD Market Cap: $29 million
- METIS/USD Circulating Supply: 6.4 million METIS
- METIS/USD Total Supply: 10 million METIS
- METIS/USD CoinMarketCap Ranking: #284
Key Levels
- Resistance: $25.00, $30.00 and $35.00
- Support: $20.00, $15.00, and $10.00
Metis DAO Technical Outlook: Bulls Regain Momentum as $25 Resistance Faces Renewed Pressure
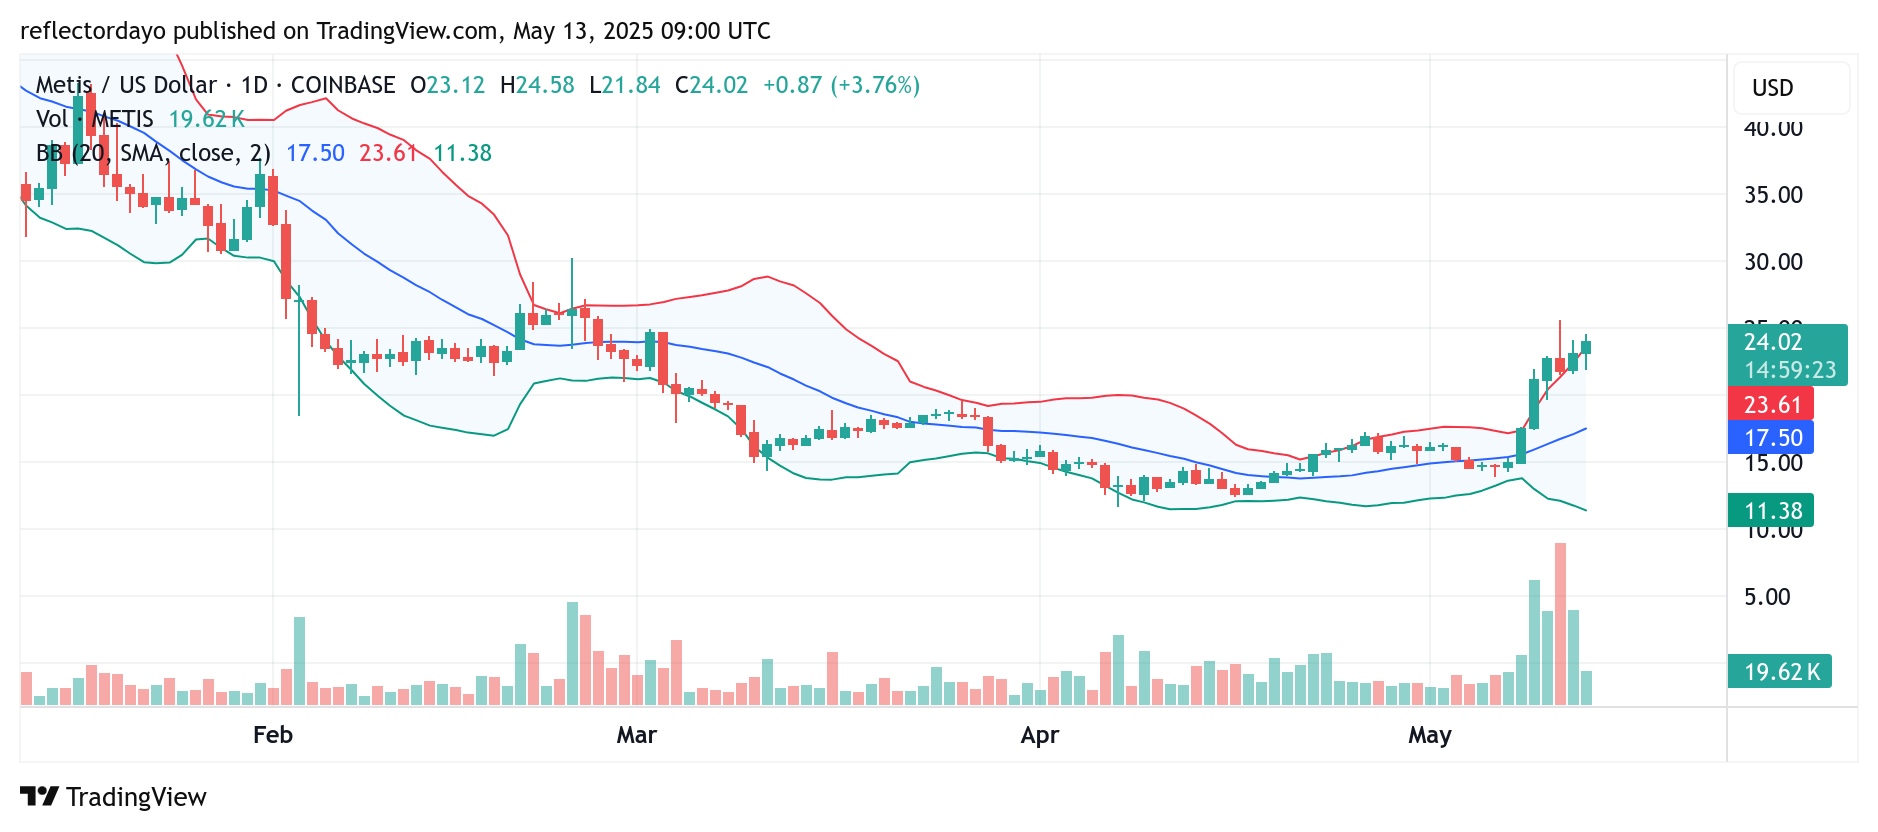
The Metis DAO market experienced a notable uptick in trading volume beginning May 8, driven by growing bullish sentiment that propelled price action out of its previous range-bound state. This surge in momentum carried the market steadily toward the critical $25 resistance level.
By May 11, as the price approached this significant threshold, trading volume intensified, signaling heightened interest and activity in the crypto market. However, the advance was met with strong resistance at $25, where supply quickly overwhelmed demand, triggering a bearish rejection.
Despite the initial pullback, bullish sentiment remained intact. Buyers re-entered the market near the $21.00 support level, creating a solid base for a renewed push upward. Since then, the price has once again been climbing toward the $25 resistance.
With pressure mounting at this key level, the bears’ position is increasingly vulnerable. If bullish momentum persists, a breakout above $25 could confirm a continuation of the current upward trend.

METIS/USD 4-Hour Chart: Bulls Hold the Line at $21 as Market Eyes Breakout at $25
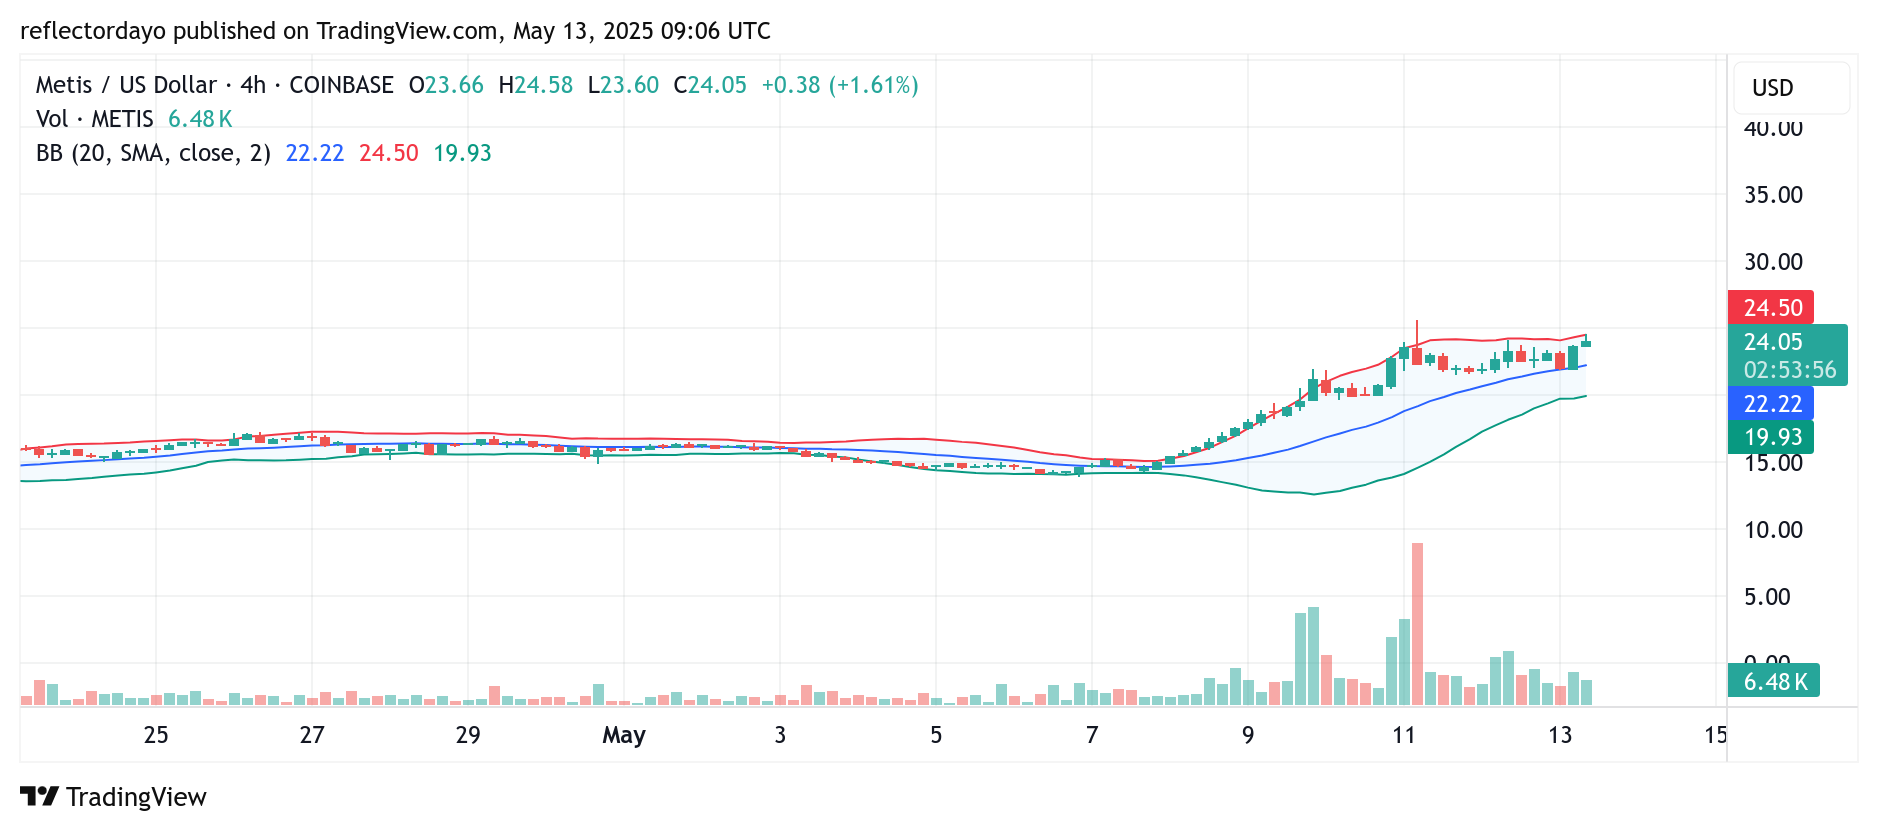
A closer look at the 4-hour chart of the METIS/USD pair reveals the growing significance of the $21 price level as a strong support zone. Price action has been consolidating just above this level, successfully fending off bearish attempts to push the market lower.
This consolidation highlights the resilience of the bulls and their ongoing effort to maintain upward momentum toward the critical $25 resistance. As long as the $21 support holds, the bullish outlook remains valid.
If both bulls and bears continue to defend their respective positions, the market may remain in a consolidation phase for some time. However, traders should closely monitor the $25 level—any breakout above it could trigger increased buying pressure and signal a potential continuation of the bullish trend.