Arbitrum Price Prediction: ARB/USD Price Could Rally Toward the Resistance Level of $1.50
Estimated Reading Time: 3 minutes
Don’t invest unless you’re prepared to lose all the money you invest. This is a high-risk investment and you are unlikely to be protected if something goes wrong. Take 2 minutes to learn more
Arbitrum Price Prediction – April 28
The Arbitrum price prediction shows that ARB is going to face moderate volatility as the coin moves to cross above the moving averages.
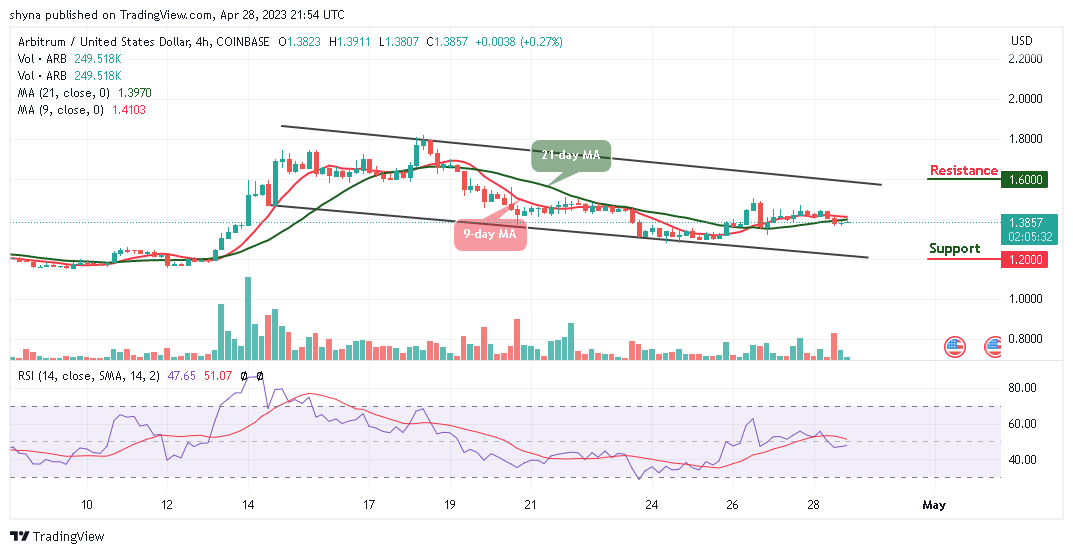
ARB/USD Long-term Trend: Ranging (4H Chart)
Key Levels:
Resistance levels: $1.60, $1.70, $1.80
Support levels: $1.20, $1.10, $1.00
ARB/USD is moving to cross above the 9-day and 21-day moving averages as the market price hovers at $1.38 with a daily gain of 0.27%. However, as the coin moves to cross above this barrier, the potential resistance can be found at the $1.50 level. Meanwhile, if the coin slide and heads toward the lower boundary of the channel, it could hit the closest support at $1.30.
Arbitrum Price Prediction: ARB/USD Ready for a Spike to the North
Looking at the daily chart, with the confirmation of the technical indicators, the Arbitrum price is going to experience the upward movement create and could create additional bullish trends as the Relative Strength Index (14) prepares to cross above the 50-level, warming up for a positive movement.
At the time of writing, ARB/USD bulls will push the coin to cross above the 9-day and 21-day moving averages, but any bearish movement toward the south could bring the Arbitrum price to a downtrend where the new investors can take advantage of investing in the coin. However, the support levels for ARB/USD can be located at $1.20, $1.10, and $1.00, while the resistance levels lie at $1.60, $1.70, and $1.80.
ARB/USD Medium-term Trend: Ranging (2H Chart)
The Arbitrum is also moving to cross above the 9-day and 21-day moving averages as the coin heads to the upside. If crosses above the 21-day moving average, the nearest resistance could be set near the upper boundary of the channel for the market price to touch the nearest resistance level of $1.45.
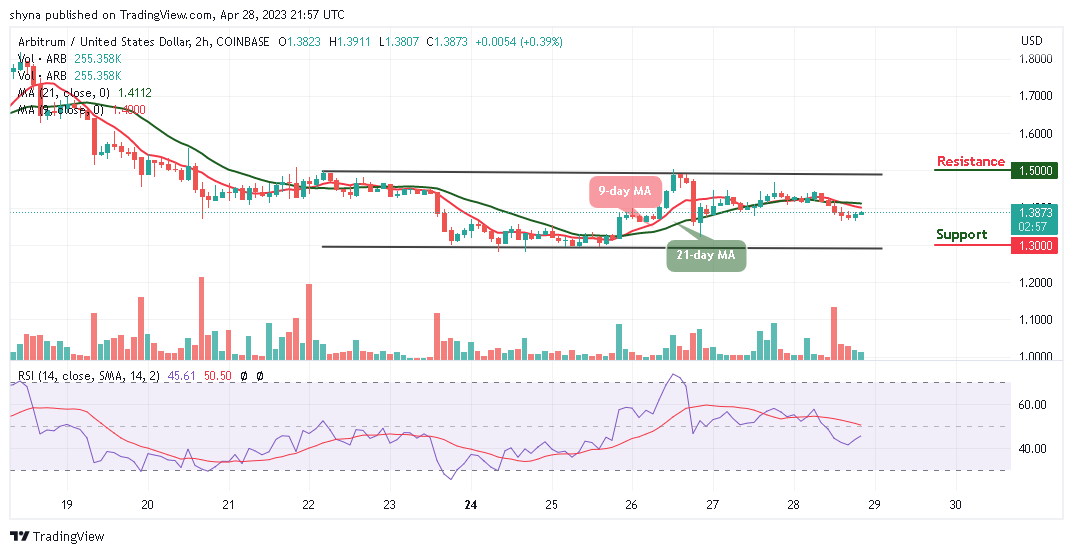
However, if the Arbitrum price heads toward the lower boundary of the channel, it can create a new low, and crossing below this barrier could hit the support level of $1.30 and below. Meanwhile, as the technical indicator, Relative Strength Index (14) moves to cross above the 50-level, the market will form a new trend and could hit the resistance level at $1.50 and above.
Place winning Arbitrum trades with us. Get ARB here