Litecoin (LTC/USD) Trade Retraces, Aiming for a Recoup at $70
Estimated Reading Time: 4 minutes
Don’t invest unless you’re prepared to lose all the money you invest. This is a high-risk investment and you are unlikely to be protected if something goes wrong. Take 2 minutes to learn more

Litecoin Price Prediction – November 15
The indices note that the LTC/USD market is portending, as the possibility of seeing the price push downward more than the current trade zone of $71.929271 seems unrealistic, given the crypto-economic trade retraces against the point of $75, aiming for a recoup at $70.
After a move to average the crucial underlying support level of $65, yesterday’s session offered arguments for today’s high of $71.975427 and a low of $70.511849. Regarding investors, the prices being maintained thus far are still reasonable enough to let the trade run for a while before taking advantage of higher valuation points. Traders should never place their positions with excessive leverage.
LTC/USD Market
Key Levels:
Resistance levels: $80, $85, $90
Support levels:$65, $60, $55
LTC/USD – Daily Chart
The LTC/USD daily chart showcases that the crypto-economic market retraces after witnessing a resistance around the line of $75, aiming for a recoup at $70.
The stochastic oscillators are positioned southward, as the blue line has dipped into the oversold region. The Bollinger Band trend lines are beginning to face northward directions to denote that buying orders are in top-notch formation. A bullish candlestick is in the making around the trending axis of the middle Bollinger Band, raising the notion that sellers are again gradually quitting the market.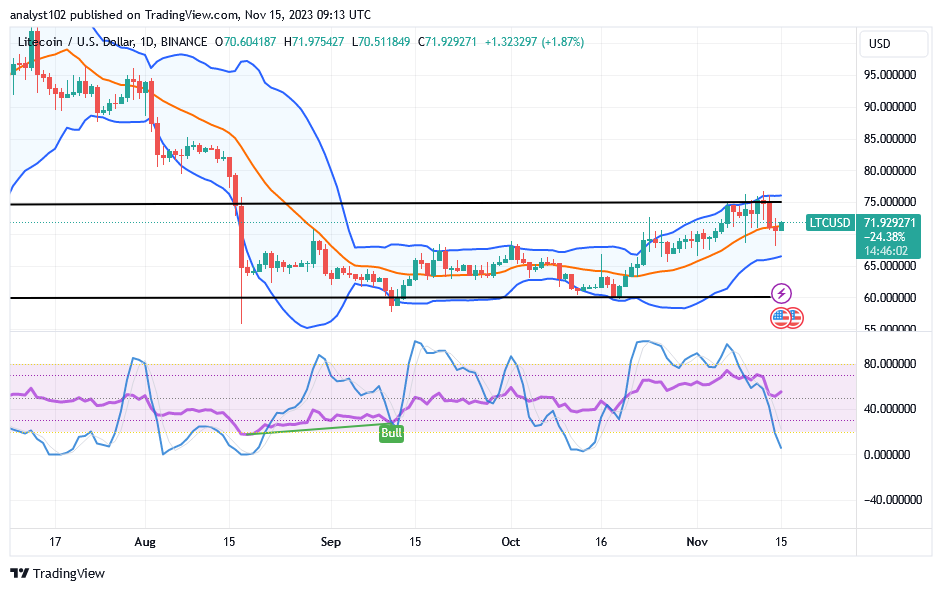
If the LTC/USD market is required to revisit $65 and its surroundings, how might sellers respond?
Any price actions that could possibly make the LTC/USD market operations go back to the lower point of $65 could give rise to the opinions of getting back decent investment placement orders as the crypto market retraces from around the barrier line of $75, aiming for a recoup at $70 at the time of this write-up.
Long-term positioners would do better to place rapid execution orders if the price simply intended to drop back sharply, followed by a brief rallying motion sign. However, traders who adhere to the investing philosophy ought to take this opportunity to return.
A scared reversal force against the motion may result in an entry for sellers to enter the market, as there has been a sign that the price is trying to draw up around the middle Bollinger Band trend line. And if that conjecture holds water, the price will probably drop for a quick retest of support near $65 to signal the end of it.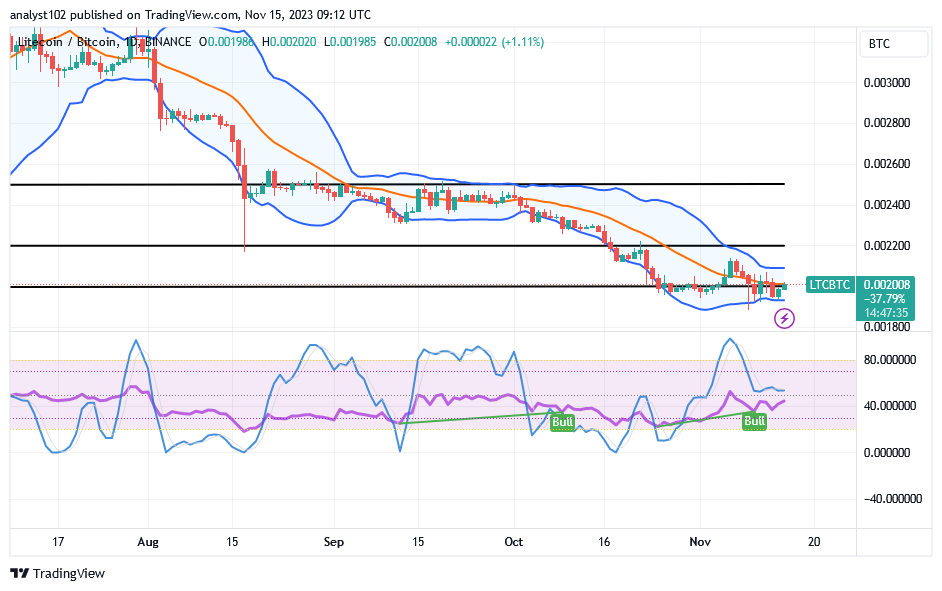
LTC/BTC Price Analysis
In contrast, the LTC/BTC daily price analysis chart showcases the trade retraces underneath the upper Bollinger Band trend line against the worth of Bitcoin, aiming for a recoup around the line of the lower Bollinger Band at the moment.
The positional construction of the Bollinger Bands indicators indicates that there is still some pressure on the base crypto economy. However, the current market line shows that it has the ability to fortify itself in order to seize profitable opportunities against the correlated cryptocurrency. In order to confirm that buyers will experience higher volatility than sellers, stochastic oscillators have been displaying buying signals.
Note: Cryptosignals.org is not a financial advisor. Do your research before investing your funds in any financial asset or presented product or event. We are not responsible for your investing results.
You can purchase Lucky Block here. Buy LBLOCK