Litecoin (LTC) Price Prediction: LTC/USDT Shows Bullish Prospects
Estimated Reading Time: 3 minutes
Don’t invest unless you’re prepared to lose all the money you invest. This is a high-risk investment and you are unlikely to be protected if something goes wrong. Take 2 minutes to learn more
Date: July 22, 2025
The Litecoin market has made significant progress along an upward path. This is evident as price action climbed from below the $80 mark to now trade above the $115 level. Technical indicators emerging from the market still support the possibility of further price increases. Let’s dive into the details:
Litecoin (LTC) Price Prediction: LTC/USDT Long-Term Trend—Bullish (Daily Chart)
Key Price Levels:
Resistance: $118.00, $120.00, $122.00
Support: $115.00, $113.00, $111.00
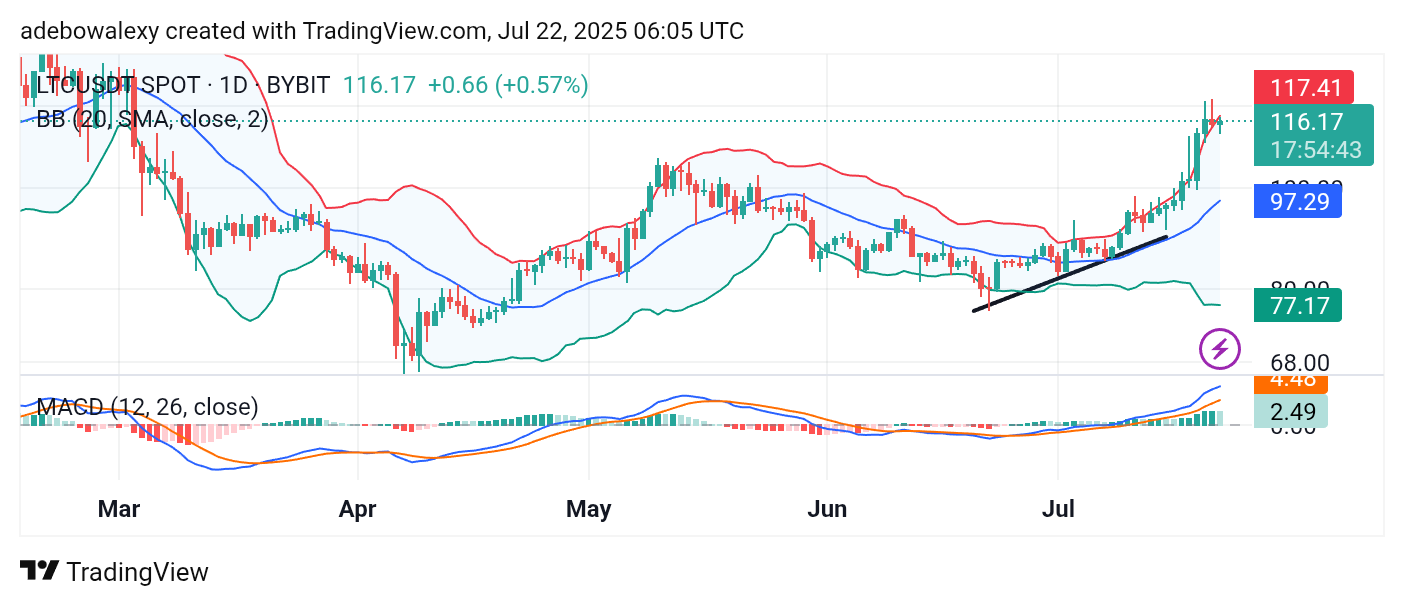
Price activity can be observed hugging the higher technical limits. The latest price candle is a green one, positioned just below the upper limit of the Bollinger Bands (BB) indicator, despite the indicator’s expansion. At the same time, the Moving Average Convergence Divergence (MACD) indicator lines remain above the equilibrium level and are climbing significantly. However, the last bar of the MACD histogram, while still above equilibrium, appears pale green, indicating a possible slowing of bullish momentum.
Litecoin (LTC) Price Prediction: LTC/USDT Bulls Retain Control
A closer look at Litecoin’s daily chart shows that price action continues to hover near the upper limit of the BB indicator. Although the current session remains bullish, the price has slightly retreated from the top band.
The MACD lines are still well above the equilibrium level and remain widely diverged. That said, the most recent MACD histogram bar signals some turbulence in bullish momentum with a fading green tone. Nonetheless, the overall trend remains bullish.
LTC/USDT Holds Critical Support (4-Hour Chart)
On the 4-hour chart, Litecoin continues to trade above the middle band of the BB indicator, maintaining its foothold above the $115 support level. The BB indicator itself maintains an upward slope and remains well-expanded. Price action has recently rebounded off the middle band and continues upward, albeit with reduced momentum.
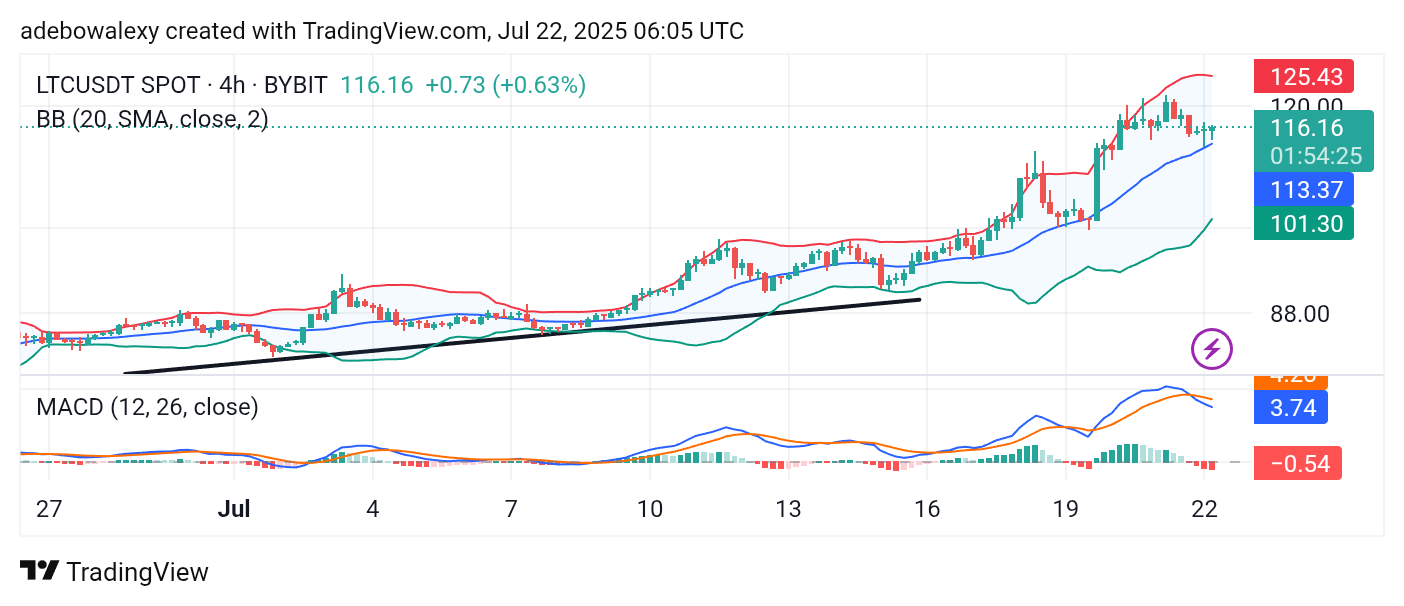
Meanwhile, the MACD lines have formed a bearish crossover above the equilibrium level, leading to the appearance of red histogram bars below equilibrium. This signals some short-term bearish pressure, which seems to contradict the current upward price movement on the chart. Nevertheless, traders can still maintain a bullish outlook toward the $118 price level in the short term.