UMA (UMAUSD) Fails to Make It Past $24.000; Price Begins a Downtrend
Estimated Reading Time: 2 minutes
Don’t invest unless you’re prepared to lose all the money you invest. This is a high-risk investment and you are unlikely to be protected if something goes wrong. Take 2 minutes to learn more
UMA Analysis – Price Begins a Decline After It Fails to Subdue $24.000
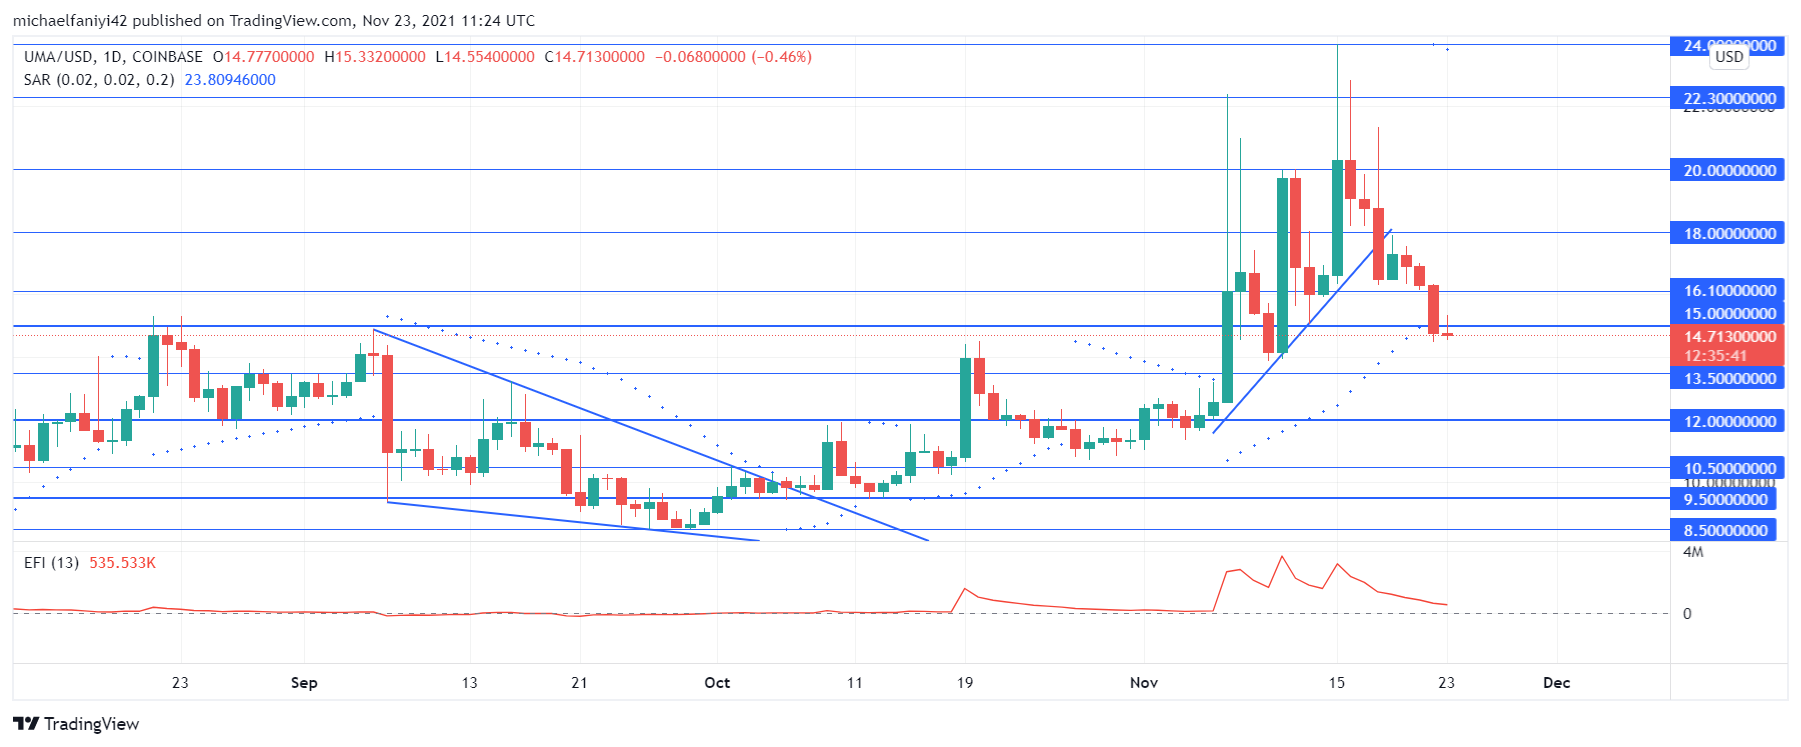
UMA fails to make it past the $24.000 resistance level and has now commenced a downtrend. The market began to fluctuate vigorously from the 7th of November, such that big candlesticks with long wicks were formed. The market kept on this trend for 12 trading days till bears stepped in to act on the market. Bearish action kicked in precisely on the 15th of November as UMA fails to make it past $24.000.
UMA Critical Levels
Resistance Levels: $24.000, $20.000
Support Levels: $15.000, $12.000
UMA has just faced another setback to its bullish agenda, which it began to plot since falling through the $15.000 price level on May 21st. It has been a real struggle for the coin as bearish pressure threatens to further drown the market. The first major attempt to restore the market above $15.000 ended in futility and the price dropped back to $8.500. Buyers restarted their campaign using a descending triangle.
During the second major period of trying to break above $15.000, upon reaching $12.000, the coin began to make very volatile moves with each daily candlestick. This helped it break the $15.000 barrier and even climb further. But the strategy took much vitality from the bulls, so much that they immediately weakened upon reaching $24.000. Price is now on the decline again since then. The plunging force line of the Elders Force Index shows the waning influence of the bulls.

Market Expectations
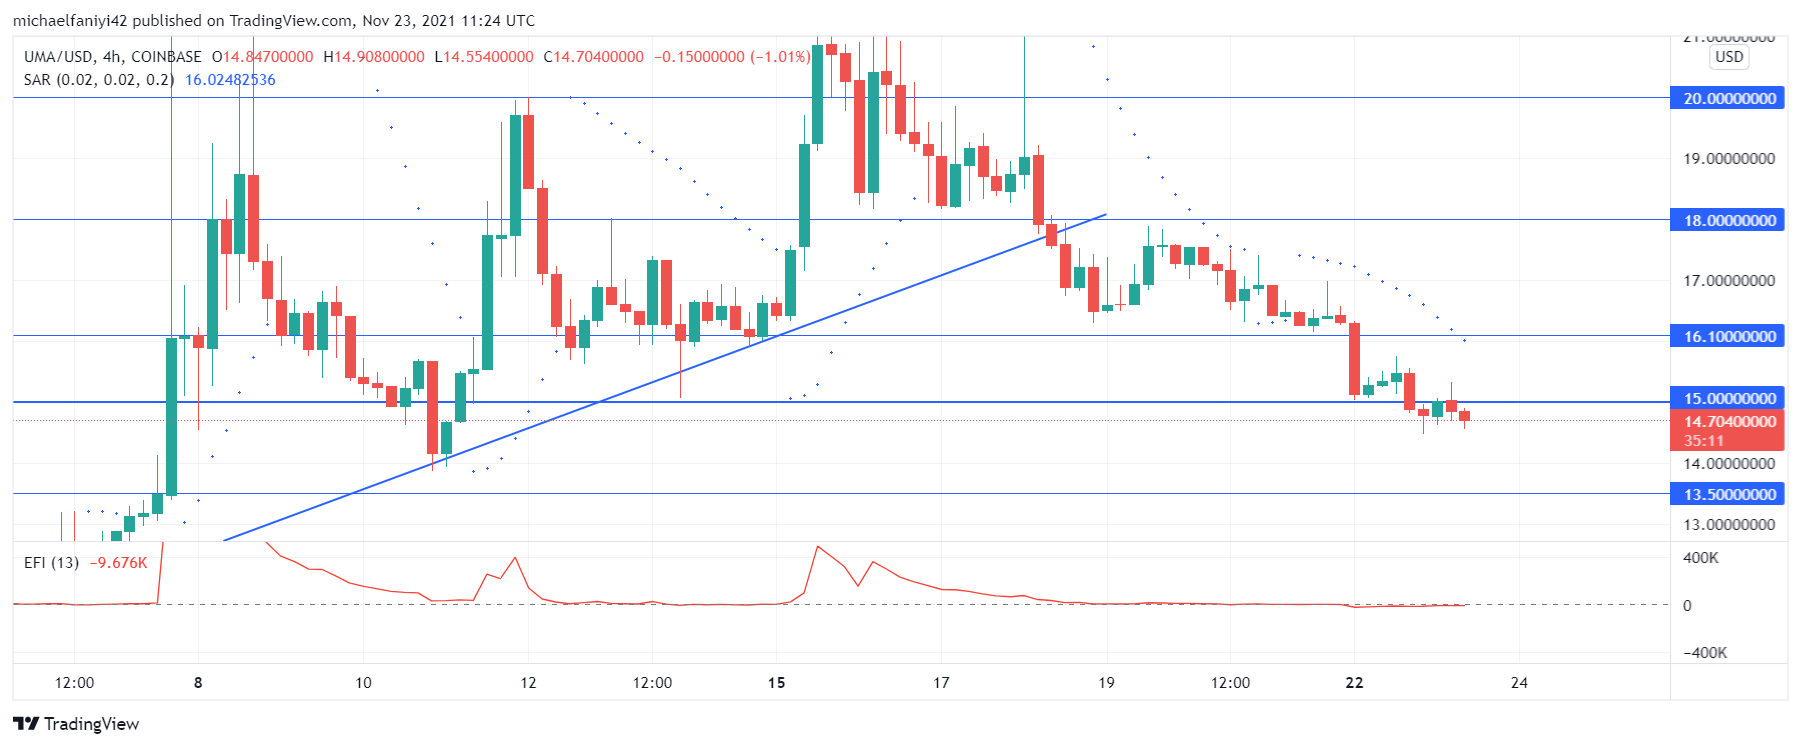
On the 4-hour chart, the market is still descending, and this is sufficiently shown by the Parabolic SAR (Stop and Reverse) indicator. The EFI power line has dropped to equilibrium as the bulls step up their effort to regain the market. Currently, the price has dropped back to the strong price level of $15.000, which is sure to pose some resistance to the fall in price. The market buyers can be relied upon to lift the coin back to $18.000 from this level.
You can purchase crypto coins here: Buy Tokens
Note: Cryptosignals.org is not a financial advisor. Do your research before investing your funds in any financial asset or presented product or event. We are not responsible for your investing results.