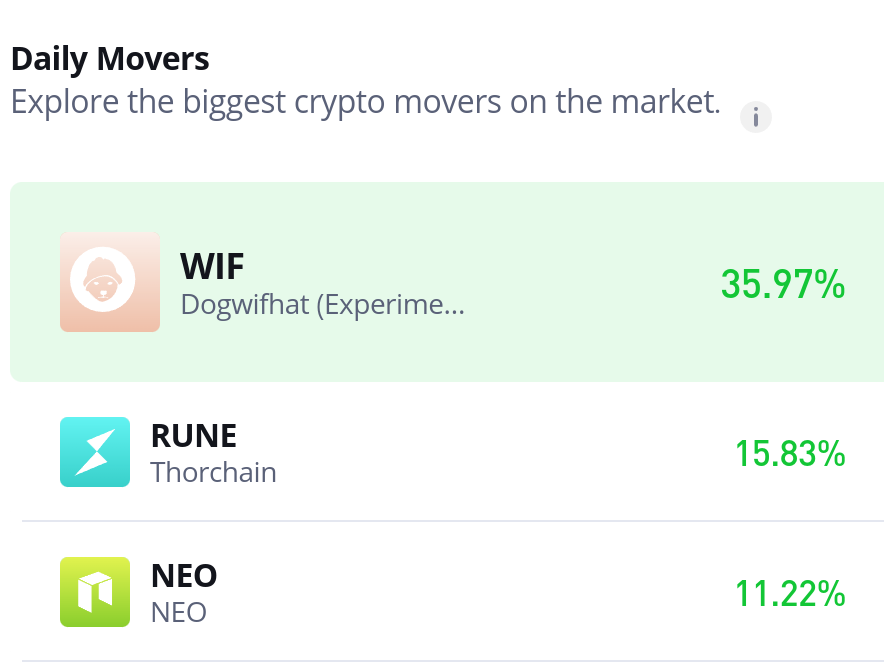
THORchain (RUNE/USD) Shows a Bullish Shift in Market Momentum
Estimated Reading Time: 3 minutes
Don’t invest unless you’re prepared to lose all the money you invest. This is a high-risk investment and you are unlikely to be protected if something goes wrong. Take 2 minutes to learn more
THORchain (RUNE/USD) has been experiencing a notable bullish trend that began on May 8, marked by a significant upward price movement. By May 10, this bullish momentum had successfully flipped the nearest resistance level at $1.50 into a support zone. The rally originated from the $1.23 level, and the breakout above $1.50 proved to be a critical turning point, drawing increased buying interest and propelling the price toward the key psychological level of $2.00.
While the ongoing upward momentum appears strong and convincing, a closer look at market indicators will help provide a clearer perspective on the trend’s sustainability.
THORchain Market Data
- RUNE/USD Price Now: $2.04
- RUNE/USD Market Cap: $722 million
- RUNE/USD Circulating Supply: 351 million RUNE
- RUNE/USD Total Supply: 425 million RUNE
- RUNE/USD CoinMarketCap Ranking: #104
Key Levels
- Resistance: $2.00, $2.10 and $2.20
- Support: $1.50, $1.23, and $1.15
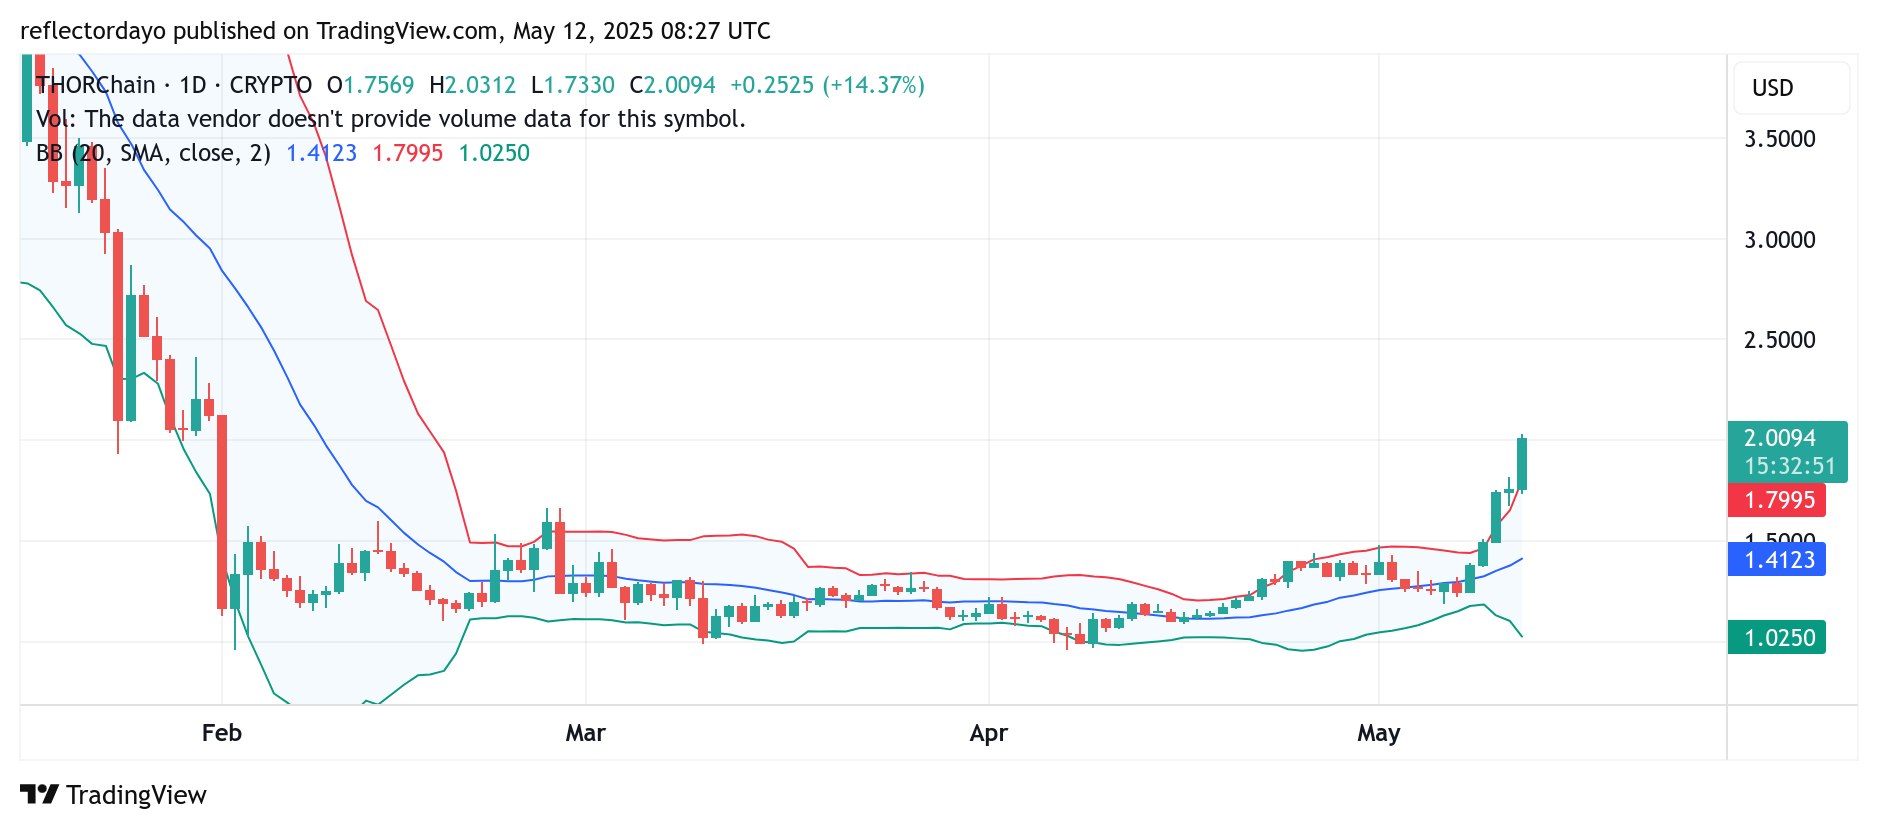
THORchain Market Outlook Through the Lens of Technical Indicators
The daily chart of THORchain (RUNE/USD) presents a clearly bullish market structure. However, the volume histogram shows relatively low bars, suggesting limited participation despite the ongoing upward trend. This implies that while buying activity is present, it may be driven by a small number of large or influential traders rather than broad market engagement.
This selective participation could still attract more bullish sentiment—especially following the recent breakout above key resistance levels such as the $1.50 mark. The strong bullish candlestick observed today underscores continued momentum, but the subdued trading volume raises concerns about the sustainability of the move.
During the previous daily session, the market briefly surged above the $2.00 level, triggering a round of profit-taking that led to a corrective pullback. This correction also increased market volatility, making price movements more prone to sharp swings. Nevertheless, the bulls appear determined, as the price has returned to hover around the $2.00 level, aiming for a breakout above it once again.
Despite the low trading volume being a potential red flag, the 4-hour chart may offer additional insights and possibly a different narrative regarding market participation.
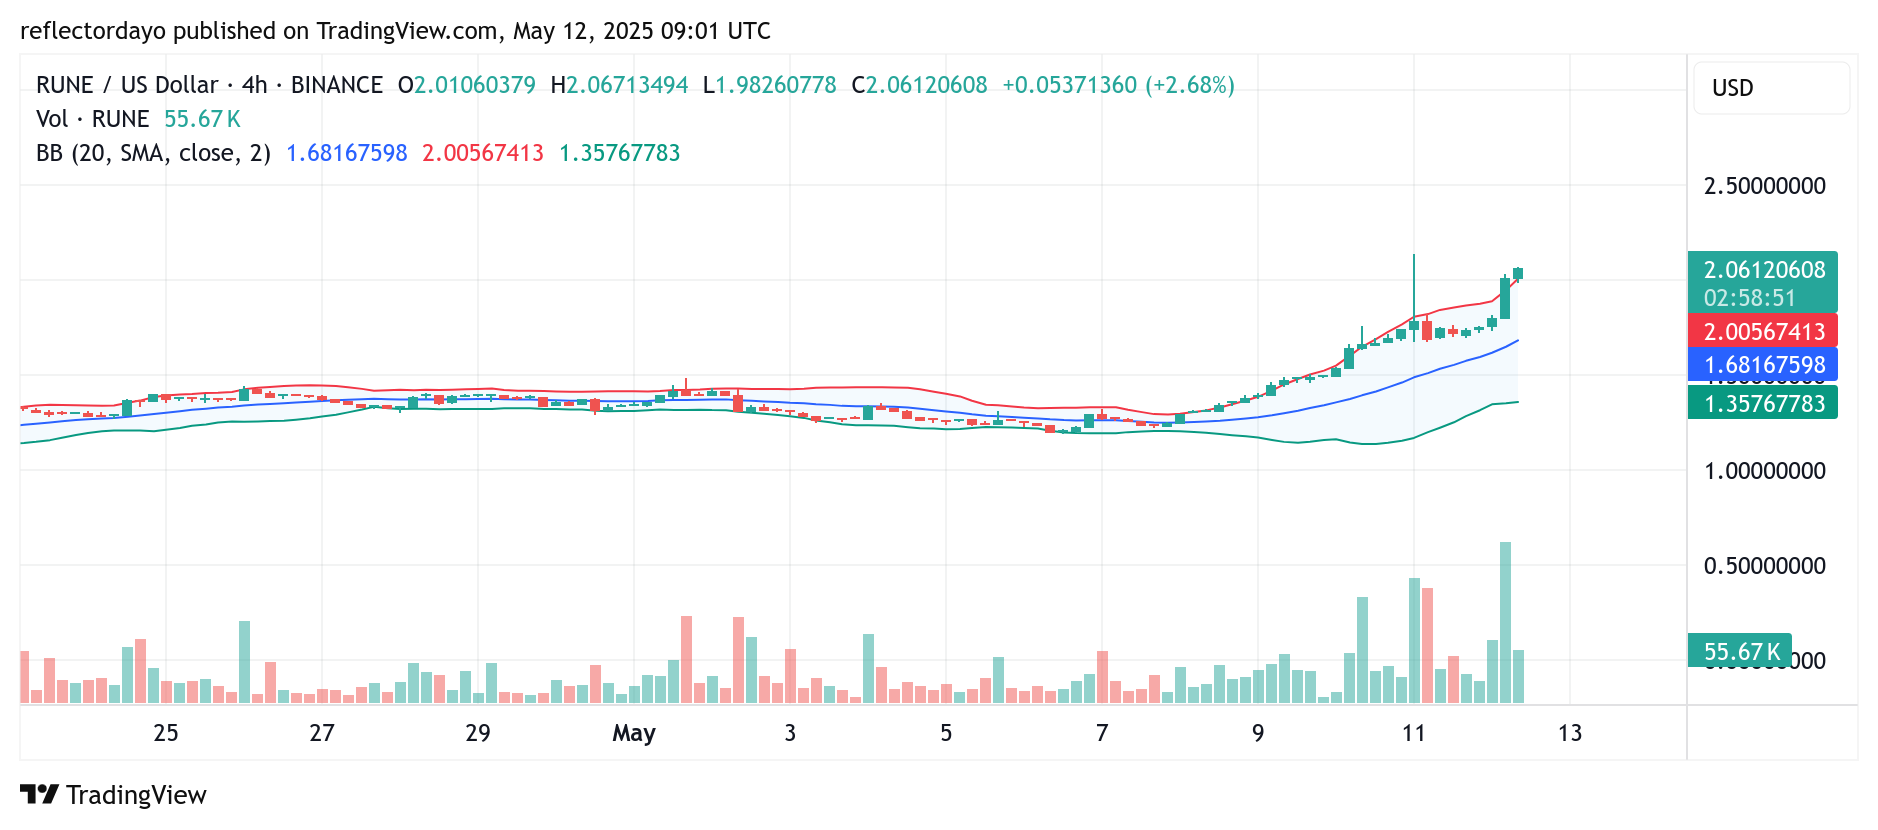
RUNE/USD 4-Hour Chart: Bullish Momentum Faces Resistance Near $2.12
The 4-hour chart for RUNE/USD shows an active and vibrant histogram, indicating increased bullish bias and upward pressure on price. This suggests that bullish sentiment is gaining strength, driving the market higher in the short term.
The most recent resistance level was established around the $2.12 mark. If the market attempts another rally toward this level and fails to break above it, consolidation may occur just above the $2.00 level. Such a development would likely confirm $2.00 as a new higher support zone, reinforcing the current bullish structure despite the slowing momentum.