Bitcoin Cash (BCH/USD) Price Struggles for Recovery
Estimated Reading Time: 3 minutes
Don’t invest unless you’re prepared to lose all the money you invest. This is a high-risk investment and you are unlikely to be protected if something goes wrong. Take 2 minutes to learn more
Bitcoin Cash Price Prediction – August 20
The Bitcoin Cash price now struggles for a recovery, trading averagely below the level of $700 resistance. The crypto’s rate of percentage is put at -0.66 to trade around the line of $655. That showcases that the recovery trading pace of the market isn’t that much encouraging.
BCH/USD Market
Key Levels:
Resistance levels: $700, $900, $1,100
Support levels: $500, $400, $300
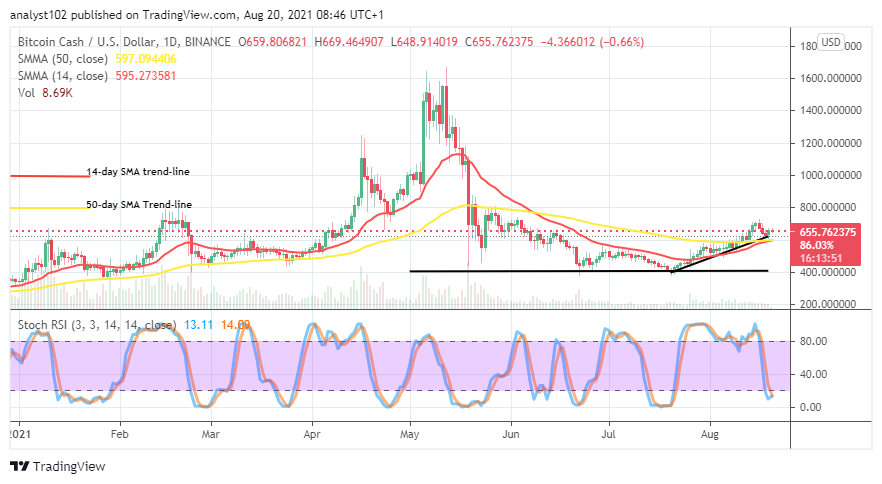
BCH/USD – Daily Chart
The daily chart of BCH/USD exhibits that crypto’s price struggles for recovery after a short line of downsizings characterized by about three days of smaller bearish candlesticks. And, it noted that all the bearish sticks appeared above the $600 line. Just about yesterday’s session, the market tended to begin a recovery motion. The 14-day SMA trend-line remains in a tight touch to the 50-day SMA trend-line from below. And, the bullish trend-line drew briefly past the SMAs to the upside. The Stochastic Oscillators are located a bit below the range 20 in the oversold region, attempting to close the lines. That signifies that there may soon be an upward swing of price.
Could the $600 line be regarded as the trading zone as the BCH/USD price struggles for a recovery, off from it?
Being as it is, the market level at $600 appears to play a crucial part in what could be the crypto’s next market direction. As the BCH/USD price now struggles for recovery, a supportive baseline might have been by bulls to capitalize their energy building upon as it has is established on a lighter outlook. A sudden reversal against the line mentioned earlier will truncate the whole efforts made by bulls.
On the downside, from a technical reading outlook of the Stochastic Oscillators, the capacity force the BCH/USD bears needed to push price downward has been fading gradually. That means the breaking of the $600 line may not achieve on time. As a result of all that, traders willing to be short on this crypto market should have to be cautious of their re-entries of trading position to avoid being caught by the bears’ trap.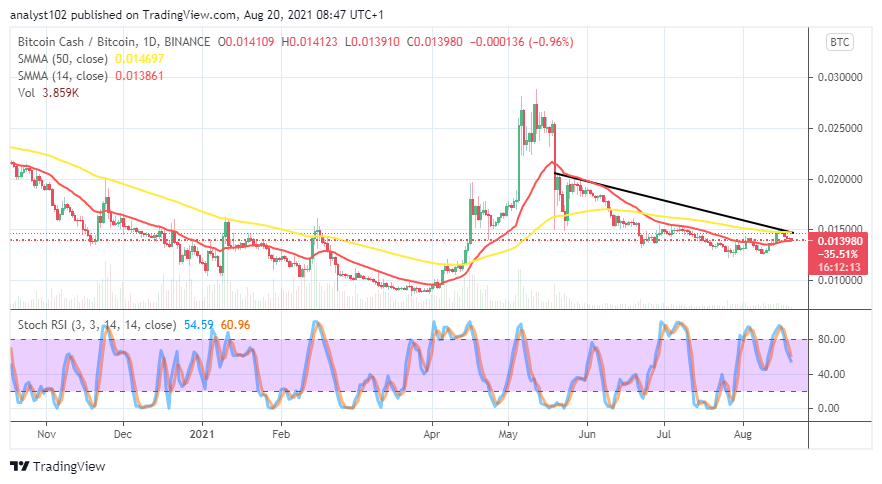
BCH/BTC Price Analysis
The Bitcoin Cash’s trending weight compared with Bitcoin’s on the daily price analysis chart shows that the base crypto’s price struggles for recovery against the counter crypto. The 14-day SMA trend-line has slightly bent northward beneath the 50-day SMA trend-line. The bearish trend-line is drawn over the SMAs, playing a backing resistance role to the bigger SMA indicator. The Stochastic Oscillators have moved southbound from the overbought region to the downside between the ranges of 80 and 40. It means that BCH may face a falling force as paired with BTC.
Note: Cryptosignals.org is not a financial advisor. Do your research before investing your funds in any financial asset or presented product or event. We are not responsible for your investing results.
You can purchase crypto coins here. Buy Tokens