Polkadot Faces Stiff Resistance as the Altcoin Rallies to $8.84 High
Estimated Reading Time: 2 minutes
Don’t invest unless you’re prepared to lose all the money you invest. This is a high-risk investment and you are unlikely to be protected if something goes wrong. Take 2 minutes to learn more

Free Crypto Signals Channel
Polkadot (DOT) Long-Term Analysis: Bullish
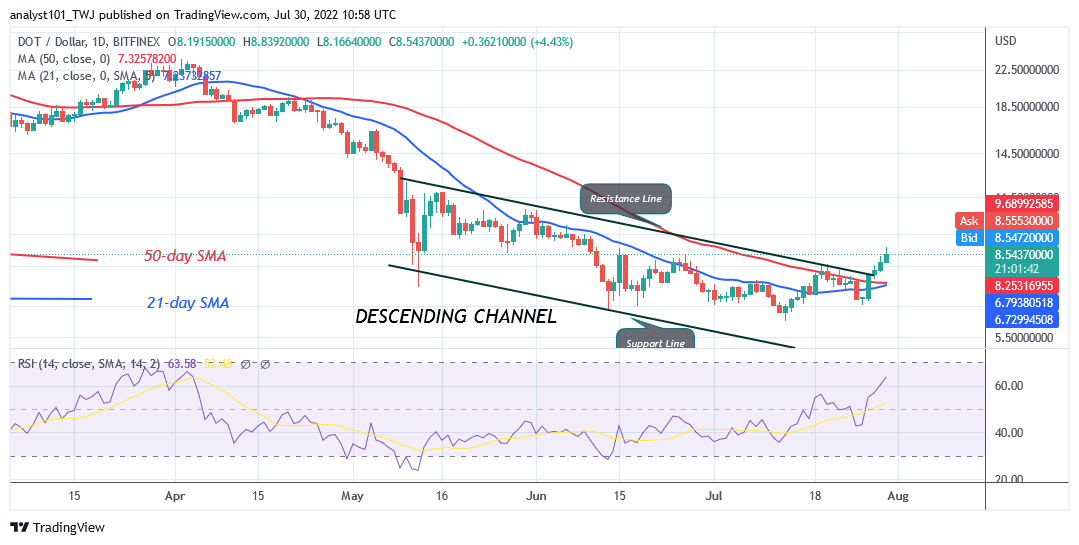
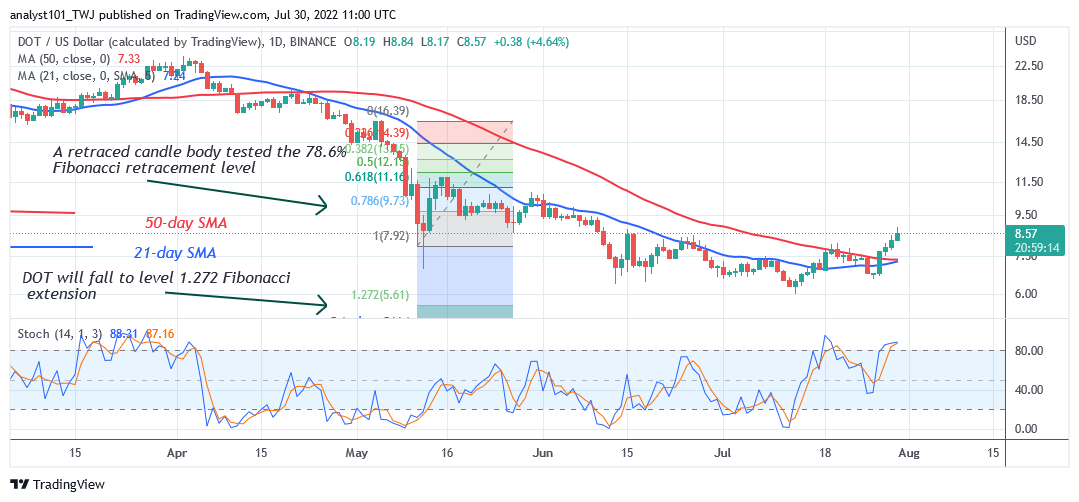
Polkadot’s (DOT) price is in an upward correction as the altcoin rallies to $8.84 high. The current uptrend has reached the high of $8.57 price level. The current price level is the resistance level of June 15. On June 15, the altcoin was restrained by the 21-day line SMA as it fell to the low of $6.01. Today, the altcoin has resumed upward but it facing rejection in the overbought region. The upward move is doubtfull because the market is overbought. On the downside, Polkadot will decline to the low of $6.01.
Polkadot (DOT) Indicator Analysis
Polkadot is at level 63 of the Relative Strength Index for period 14. It indicates that the altcoin is in the bullish trend zone and may further rise. The crypto’s price is above the 21-day line SMA and the 50-day line SMA indicating a further upward movement of the cryptocurrency. DOT is above the 80% range of the daily stochastic. The market is overbought and the altcoin may decline. The 21-day line SMA and 50-day line SMA are making U-turns.
Technical indicators:
Major Resistance Levels – $10, $12, $14
Major Support Levels – $8, $6, $4
What Is the Next Direction for Polkadot (DOT)?
Polkadot is in an upward move as the altcoin rallies to $8.84 high. The up trends are facing rejection at the recent high. This is because the market has reached the overbought region.
You can purchase crypto coins here. Buy LBLOCK
Note: Cryptosignals.org is not a 1a financial advisor. Do your research before investing your funds in any financial asset or presented product or event. We are not responsible for your investing results