Polkadot Is Confined to a Range as Bulls Make Effort to Breach the $8 High
Estimated Reading Time: 2 minutes
Don’t invest unless you’re prepared to lose all the money you invest. This is a high-risk investment and you are unlikely to be protected if something goes wrong. Take 2 minutes to learn more

Free Crypto Signals Channel
Polkadot (DOT) Long-Term Analysis: Bearish
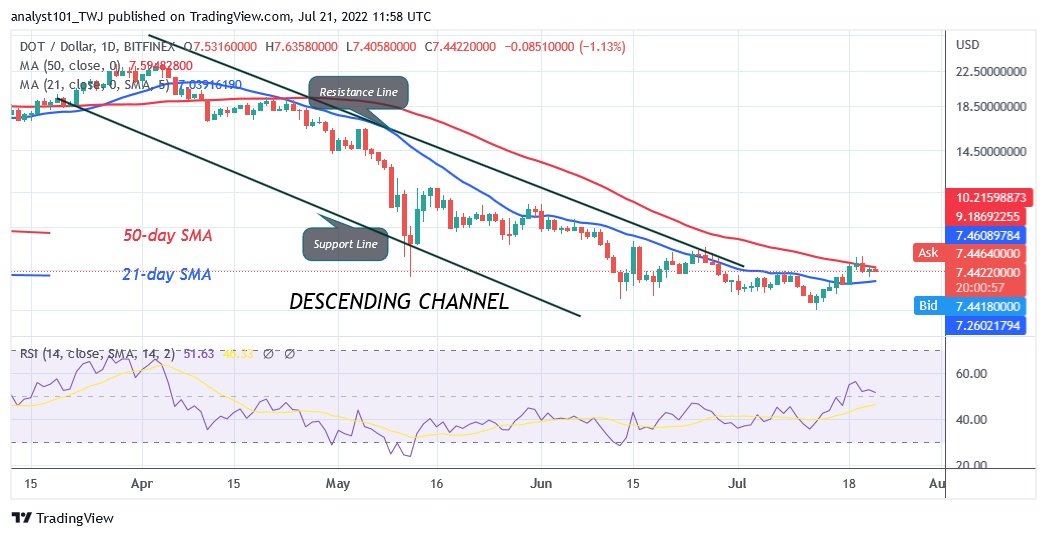
Polkadot’s (DOT) price is in a downward correction as bulls make effort to breach the $8 high. The bulls broke the 21-day line SMA but failed to break the 50-day line SMA. Because of that, the cryptocurrency is fluctuating between the moving average lines. The altcoin will trend when the moving average lines are breached. On the upside, if the bulls break the 50-day line SMA, Polkadot will rally to the highs of $10 and $12 price levels. Similarly, if the bears breach the 21-day line SMA, the downtrend will resume. The altcoin will decline to the low of $6.25
Polkadot (DOT) Indicator Analysis
The altcoin is at level 51 of the Relative Strength Index for period 14. It indicates that there is a balance between supply and demand. The crypto’s price is above the 21-day line SMA but below the 50-day line SMA indicating a possible range-bound move of the cryptocurrency. DOT is below the 80% range of the daily stochastic. The market is in a bearish momentum. Sellers are emerging from the overbought region of the market. The 21-day line SMA and 50-day line SMA are sloping southward indicating a downtrend.
Technical indicators:
Major Resistance Levels – $10, $12, $14
Major Support Levels – $8, $6, $4
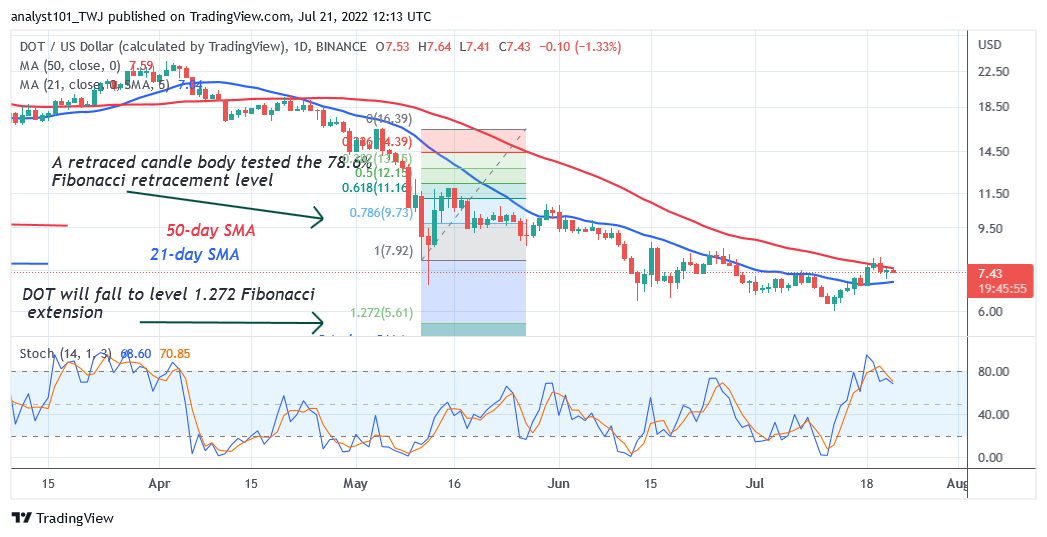
What Is the Next Direction for Polkadot (DOT)?
Polkadot is likely to decline as bulls make effort to breach the $8 high. The altcoin has retraced but it is fluctuating below the resistance at $8. Meanwhile, on May 11 downtrend; a retraced candle body tested the 78.6% Fibonacci retracement level. The retracement suggests that DOT price will fall to level 1.272 Fibonacci extension or level $5.61.
You can purchase crypto coins here. Buy LBLOCK
Note: Cryptosignals.org is not a 1a financial advisor. Do your research before investing your funds in any financial asset or presented product or event. We are not responsible for your investing results