Ethereum Keeps Losing Ground as It Faces Rejection at $2,800
Estimated Reading Time: 2 minutes
Don’t invest unless you’re prepared to lose all the money you invest. This is a high-risk investment and you are unlikely to be protected if something goes wrong. Take 2 minutes to learn more
Ethereum Price Long-Term Analysis: Ranging
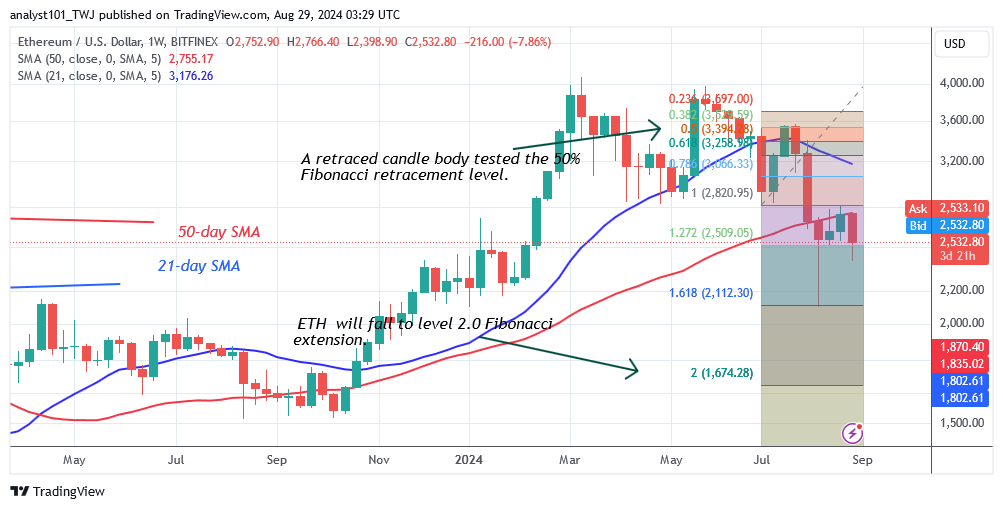
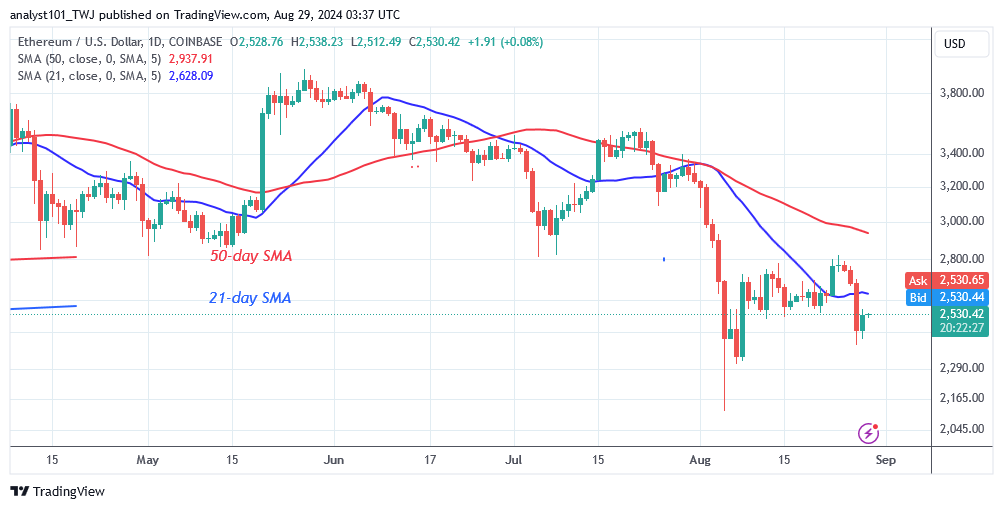
The Ethereum (ETH) price begins a range-bound trend as it faces rejection at $2,800. The bearish momentum reached a low of $2,116 before returning on August 5. The biggest altcoin trades sideways as buyers try to hold the price above the moving average lines. On August 23, the bullish momentum broke above the 21-day SMA but was halted at the $2,800 level.
Ether has dropped below the moving average lines, reaching a low above $2,400. On the downside, if the bears break below the current support of $2,400, the altcoin would fall lower to the lows of $2,100 and $2,000 in price.
Technical indicators:
Major Resistance Levels – $3, 600, $3,800, $4,000
Major Support Levels – $2.600, $2, 400, $2,200
Ethereum Indicator Analysis
Ether’s price has fallen below the moving average lines following a rejection at the high of $2,800. Following its drop, the cryptocurrency was caught between moving average lines. Ether will fall since the price bars are below the moving average lines.
Conclusion
Ethereum is declining while moving sideways as it faces rejection at $2,800. The resistance at $2,800 has resisted the upward surge three times. Ether is trading just above the $2,400 support level as the cryptocurrency faces rejection at its most recent peak. On the downside, Ether may fall if the bears break below the $2,400 support. The crypto signal is bearish as the altcoin revisits the recent low of $2,116.
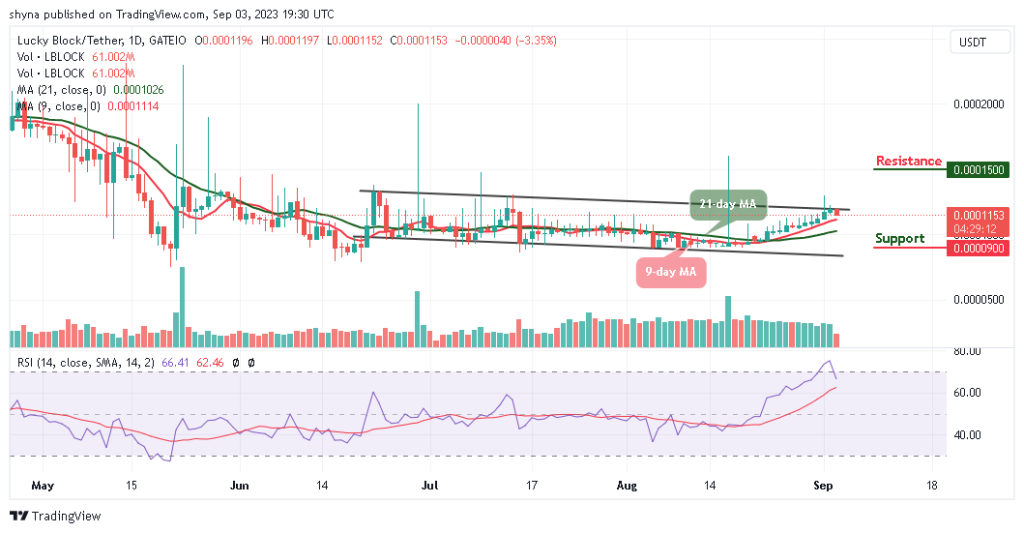
You can purchase Lucky Block here. Buy LBLOCK
Note: Cryptosignals.org is not a financial advisor. Do your research before investing your funds in any financial asset or presented product or event. We are not responsible for your investing results.