Ethereum Challenges the $2,727 Barrier as It Faces a Possible Decline
Estimated Reading Time: 2 minutes
Don’t invest unless you’re prepared to lose all the money you invest. This is a high-risk investment and you are unlikely to be protected if something goes wrong. Take 2 minutes to learn more

Ethereum Price Long-Term Analysis: Bearish
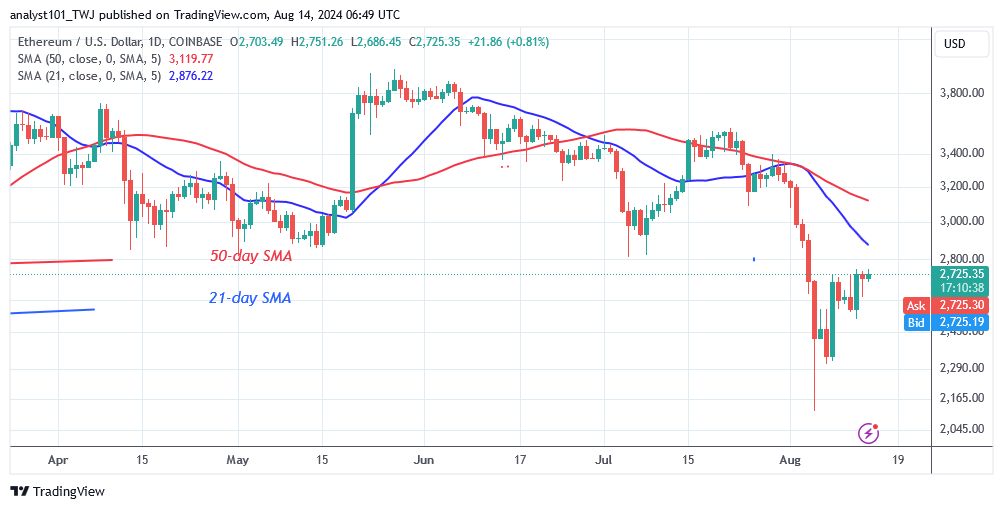
The price of Ethereum (ETH) drops below the moving average lines, indicating a possible decline. Ether is currently trading in a range following its recovery from the price drop on August 5. The bearish momentum was halted above the $2,200 barrier as bulls purchased the dips. The largest altcoin trades above the $2,200 support but below the moving average lines.
However, since August 8, the positive momentum has stalled below $2,700. If the initial barrier is crossed, Ether will reach a high of $2,800. Further price increases are unlikely since the altcoin will encounter strong selling pressure near $2,800, or the 21-day SMA. However, if Ether fails to achieve its current high, selling pressure will return. The altcoin will revisit its prior lows of $2,500 and $2,000. Meanwhile, the altcoin is currently valued at $2,721 as of this writing.
Technical indicators:
Major Resistance Levels – $3, 600, $3,800, $4,000
Major Support Levels – $2.600, $2, 400, $2,200
Ethereum Indicator Analysis
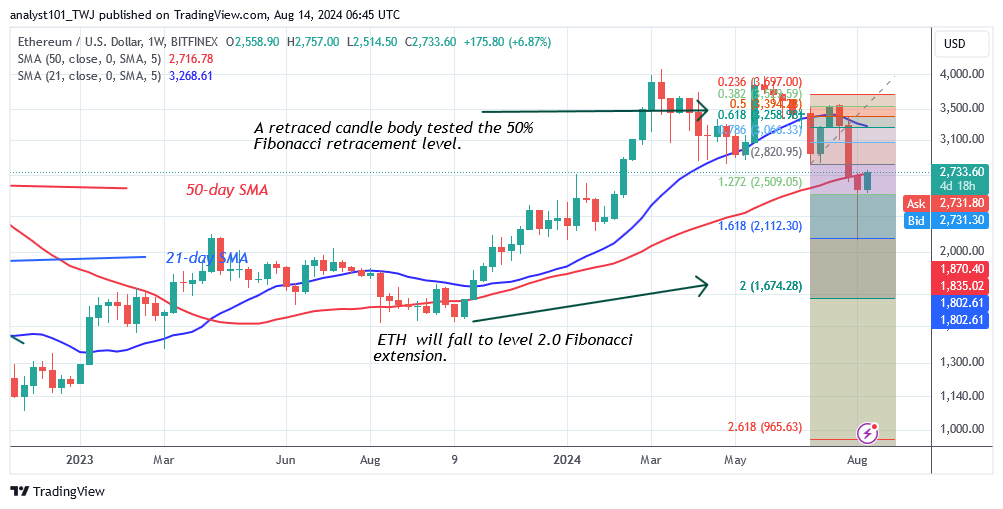
Both charts show Ether price bars below the moving average lines. On the weekly chart, bullish momentum has stalled at the 50-day SMA. The bullish trend will restart if the latest high is broken. Selling pressure will return if buyers fail to keep the price above the 50-day SMA.
Conclusion
Ethereum trades above $2,200 but below $2,800, awaiting a trend, as it faces a possible decline. The altcoin has been locked in a range for the past week since the negative trend ended on August 5. According to the price indication, Ether will fall lower to its historical lows. In other words, the crypto signal is negative, with Ether facing rejection at its recent high.
You can purchase Lucky Block here. Buy LBLOCK
Note: Cryptosignals.org is not a financial advisor. Do your research before investing your funds in any financial asset or presented product or event. We are not responsible for your investing results.