Bitcoin (BTC/USD) Market Reverses Valuation at $40,000
Estimated Reading Time: 3 minutes
Don’t invest unless you’re prepared to lose all the money you invest. This is a high-risk investment and you are unlikely to be protected if something goes wrong. Take 2 minutes to learn more
Bitcoin Price Prediction – August 4
There has been a financial record that the BTC/USD market reverses valuation after fluctuations around the level of $40,000. The crypto’s price now trades around $38,183 at a negative percentage rate of about 1.35.
BTC/USD Market
Key Levels:
Resistance levels: $40,000, $42,500, $45,000
Support levels: $35,000, $32,500, $30,000
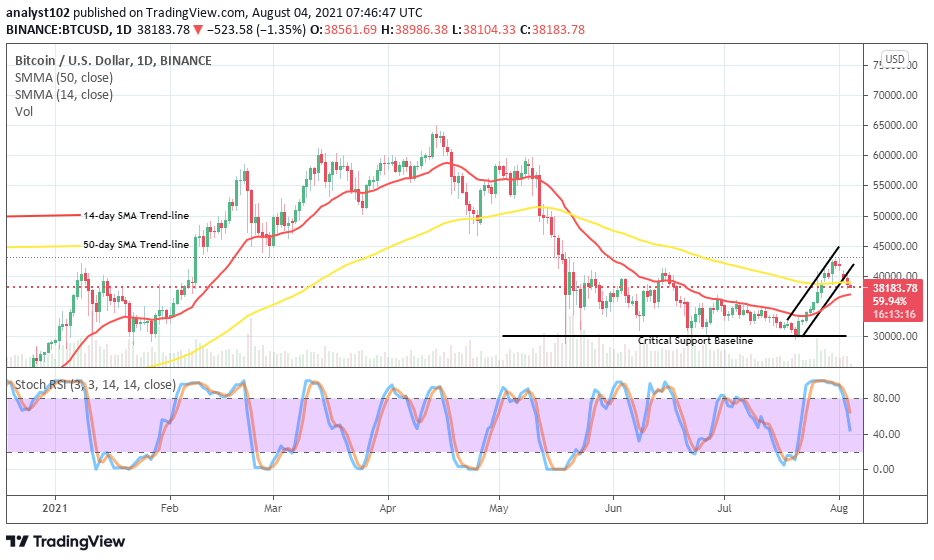
BTC/USD – Daily Chart
The BTC/USD daily chart shows that the crypto market reverses valuation around the main level at $40,000. The market reversion against the line happened during the August 2 rd trading session, while it was apparent that the force to the upside couldn’t hold more. In the meantime, the bullish channel trend lines drawn across the SMAs in anticipation that the crypto economy may in a near time tend to re-feature back to an uptrend movement. The 14-day SMA trend-line is beneath the 50-day SMA trend-line, seemingly attempting to cross to the south. The Stochastic Oscillators have crossed southbound from the overbought region, pointing downward near range 40 to suggest that a kind of depreciation moving motion is ongoing.
Would the BTC/USD price get depreciated further as the crypto market reverses valuation?
Going by the reading of the BTC/USD daily trading chart, the crypto economy may get depreciated further, taking the current slow and steady pace downward pushes that price keeps into consideration as the market reverses valuation around the level of $40,000. Bulls would have to be very cautious of re-launching their presence in the market for now as there has been no significant signal to back any forces to the upside.
On the downside, as the crypto market reverses valuation down below the line of $40,000, the BTC/USD market bears needed to intensify efforts to cause more falling pressures rather than preying on the kind of current low-active downward pushes. The reading of the market’s strength by the Stochastic Oscillators suggests that bears still have the chance to control the movement in the crypto economy.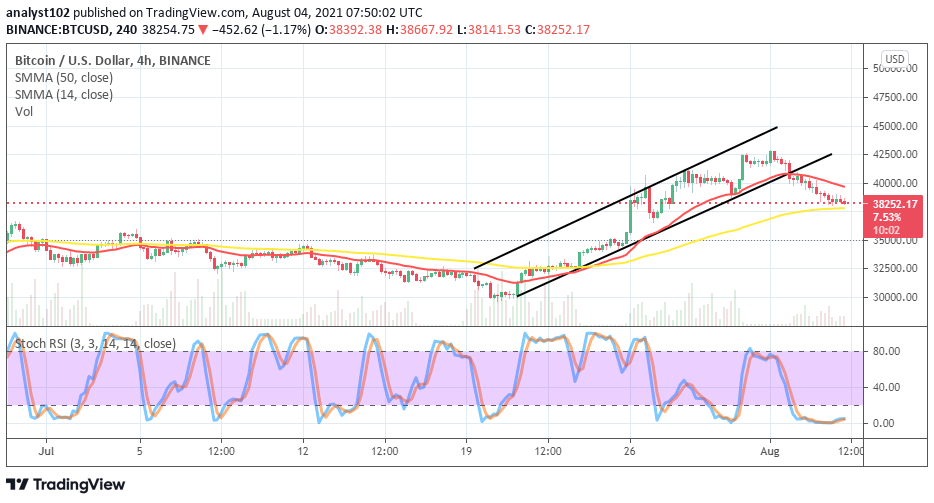
BTC/USD 4-hour Chart
The BTC/USD medium-term chart also reveals that the crypto market reverses valuation. It shows that the reversion took effect around the line at $42,500 from the beginning of August until the present. The 14-day SMA trend-line has slightly bent southward, a bit above the 50-day SMA trend-line. The Stochastic Oscillators are in the oversold region, consolidating to indicate that the downward forces are still in focus. The current trading situation needed to be cautious dealing with the exertion of any position opening.
Note: Cryptosignals.org is not a financial advisor. Do your research before investing your funds in any financial asset or presented product or event. We are not responsible for your investing results.
You can purchase crypto coins here. Buy Tokens