Polkadot (DOT/USDT) Prepares to Hold Above $4.790 for a Short-term Bounce
Estimated Reading Time: 3 minutes
Don’t invest unless you’re prepared to lose all the money you invest. This is a high-risk investment and you are unlikely to be protected if something goes wrong. Take 2 minutes to learn more
Polkadot Long-term Analysis: Ranging
The market for Polkadot against the Tether has been facing strong and prolonged selling pressure since the start of this new year. This can be seen in the sharp drag down after hitting the $5.610 critical level at the beginning of the year.
Recently, the price seems to have stabilized with no loss around the Guppy Multiple Moving Averages (GMMAs). However, the appearance of the Stochastic RSI suggests the pair may start an upside shift in the near term.
To this end, Polkadot needs to maintain a hold above the nearest support level to actualize this move, as signaled by the indicators.
Currently, Polkadot trades at $4.880, with 2.11 million traded volumes at the start of the week.
Technical Indicators
Major Resistance Levels: $4.979, $5.247, and $5.610
Major Support Levels: $4.790, $4.500, and $4.200
Polkadot Technical Analysis
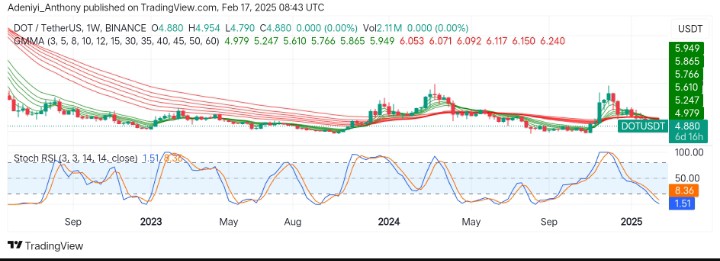
On the weekly timeframe, Polkadot against the USDT is attempting a reversal while moving sideways. The GMMAs suggest bearish control as the short-period EMAs are slightly below the long-period EMAs. To this end, a bullish crossover is needed for this trend shift.
On the other hand, the Stochastic RSI signal selling pressure may be waning as the blue line reads an extremely low value. This suggests a potential bounce might be on the horizon if bullish traders swing into action.
To this end, the price needs to break above $4.790 while aiming at $5.950 for a strong bullish breakout.
DOT/USDT Analysis: Expectations
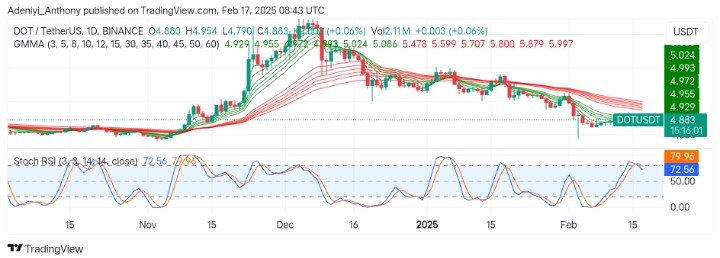
On the daily timeframe, an upward shift begins to materialize as the green EMAs tend toward the red EMAs, suggesting a possible trend shift. However, the gap between the GMMAs suggests the bears are still in control of the market.
On the other hand, the Stochastic RSI shows that the slightly noticed upside movement has met a stronger resistance, and a pullback may be necessary as the line retraces to the 70-mark level. This suggests a short-term pullback before continuation.
To this end, if prices sustain above $4.880, a push toward $5.480 may be possible; otherwise, a dip toward $4.500 may be witnessed.
You can purchase crypto coins here. Buy LBlock