BNB (BNB/USDT) Building a Strong Base for Continued Upside Movement
Estimated Reading Time: 3 minutes
Don’t invest unless you’re prepared to lose all the money you invest. This is a high-risk investment and you are unlikely to be protected if something goes wrong. Take 2 minutes to learn more
BNB Mid-term Analysis: Ranging
Prior to this time, BNB against Tether has been extending bullish frontiers, claiming resistance levels with a steady uptrend. However, the market remains bullish, but price movement suggests momentum is dropping as the pair pulls back towards the recent support level.
Currently, the price of the pair appears to be consolidating after an impressive rally in the previous session, raising a doubt about its further uptrend or a minor correction, as the price operates within the Guppy Multiple Moving Averages (GMMA) and the Stochastic RSI shifts inward.
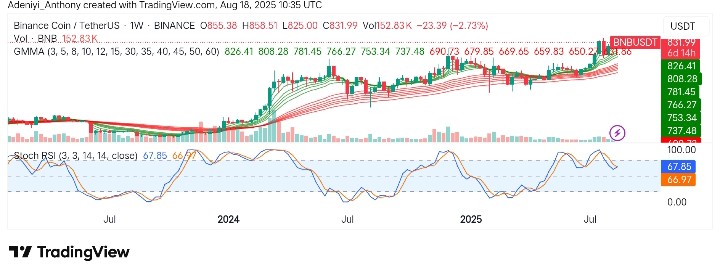
At the moment, BNB trades at $831.99 with over 152 thousand traded volumes at the start of the week.
Technical Indicators
Major Resistance Levels: $858, $900, and $1,000
Major Support Levels: $822, $780, and $700
BNB Technical Analysis
Previously, the market analysis of BNB against Tether on a weekly timeframe showed the pair on a strong bullish rally with the price rising towards the $858 resistance level. However, it seems bullish momentum is waning as the price drops within the lines of the short-period EMAs despite the bullish position of the indicator.
The stochastic RSI, on the other hand, shows the end of the current pullback situation is near as the lines prepare for another round of bullish crossover. To this end, the market is at a crucial juncture, with potential for a bullish continuation extending to $1,000 or a range-bound, if not corrective, move towards $750 in the near term.
BNB/USDT Analysis: Expectations
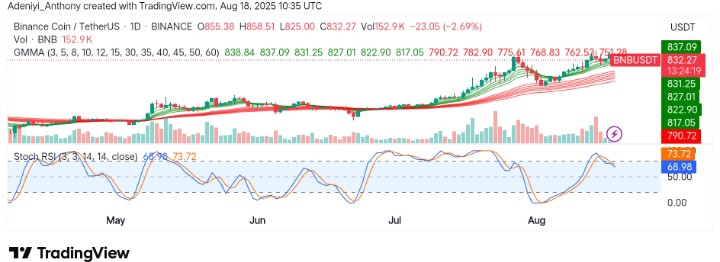
On the daily timeframe, the analysis of BNB/USDT shows the pair’s uptrend is still intact, with the price maintaining a strong momentum around $858, with the GMMA structure dictating bullish continuation. However, the price needs to break above the current resistance for a strong move to the next, as the Stochastic RSI warns of a possible correction to the south despite increasing volume.
If the momentum oscillator drops further from its overbought zone and the price falls below $820, this could indicate directional change. A move below $808 would further confirm that the pair has lost its bullish momentum.
Moreover, @cryptozeinab suggests BNB could see more upside movement if the support at $750 holds strong. The analyst suggests a new high is on the way if this support holds.
$BNB has been steadily climbing inside a clean ascending channel since 2024. Momentum remains bullish with strong support building around $750. If this holds, the next big move could be a breakout to new highs. pic.twitter.com/oOHaz77HrR
— Crypto Zeinab (@CryptoZeinab) August 18, 2025
You can purchase crypto coins here. Buy Crypto
