BNB (BNB/USDT) Hopes for More Upward Trajectory Beyond $800
Estimated Reading Time: 3 minutes
Don’t invest unless you’re prepared to lose all the money you invest. This is a high-risk investment and you are unlikely to be protected if something goes wrong. Take 2 minutes to learn more
BNB Mid-term Analysis: Bullish
The market for BNB against Tether is currently experiencing a significant upward trend, displaying impressive momentum as it continues to rise. The price movement reveals a strong bullish pressure as the pair poises for potential further growth beyond the current psychological base.
Recently, the pair has sharply rallied from a lower price level, with a breakout above $800. This action suggests the price has cleared a critical level and continues to forge ahead as bullish momentum increases.
Currently, BNB trades at $813.03, recording over 130K traded volumes for the week.
Technical Indicators
Major Resistance Levels: $818.00, $827.00, and $850.00
Major Support Levels: $808.00, $782.31, and $757.60
BNB Technical Analysis
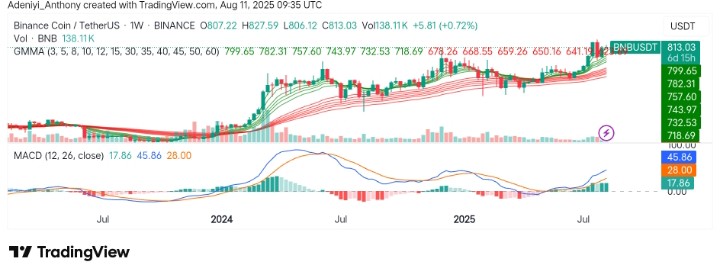
On the weekly timeframe, the analysis of BNB against Tether reveals that the price is in a strong uptrend, as indicated by the direction of the Guppy Multiple Moving Averages (GMMA) and the positioning of its lines. Also, the volumes appear to be rising as the participation level validates further price increases.
From another angle, the MACD is also displaying potential for continued bullish momentum, as the lines and histogram indicate buying strength is still present. However, caution is warranted as price might be moving at a decreasing rate, as seen in the relative height of the histograms.
To this end, if bullish participation continues to increase, further movement towards $850 may be guaranteed. Also, a slight pullback to $800 might serve as a nice reentry level for further uptrend; otherwise, a break below this level might suggest deeper retracement.
BNBUSDT Analysis: Poised for More Gains
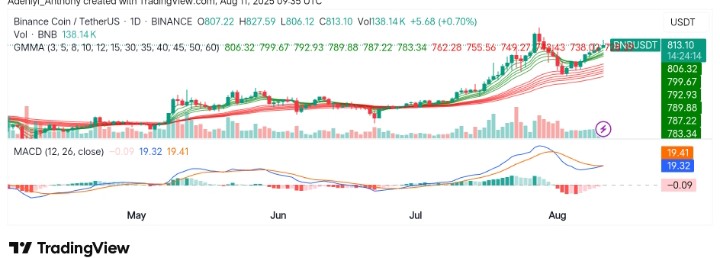
On the daily chart, BNB/USDT continues to show potential for further gains with the price hovering around $813. This demonstrates a steady push through the key resistance level as the GMMA faces the north, with the price above it.
Also, the MACD, on the other hand, displays a healthy bullish crossover with volumes consistent with buying interest, which suggests sustained momentum as the price targets immediate resistance.
To this end, with positive MACD and increasing volume, the $827 resistance might be broken before the end of this session; otherwise, the price might start to oscillate around this level.
You can purchase crypto coins here. Buy LBlock