Balancer (BAL/USD) Bulls Maintain Dominance Against the Bears
Estimated Reading Time: 2 minutes
Don’t invest unless you’re prepared to lose all the money you invest. This is a high-risk investment and you are unlikely to be protected if something goes wrong. Take 2 minutes to learn more
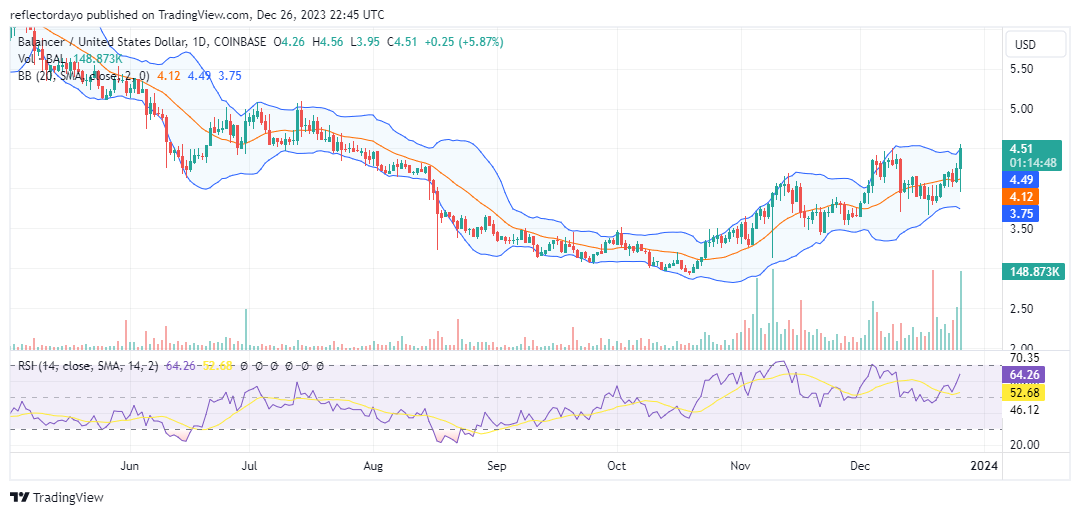
On October 20, the Balancer market initiated a bullish trend, starting from the $3.00 price level. Initially, the bulls appeared to dominate the market unilaterally. However, when the price reached $4.00, a bearish market phase was triggered. Subsequently, the bulls regrouped around the $3.50 price level, forming the first higher lows, which is a bullish signal.
Balancer Market Data
- BAL/USD Price Now: $4.50
- BAL/USD Market Cap: $242,581,530
- BAL/USD Circulating Supply: 54,170,027 BAL
- BAL/USD Total Supply: 60,851,933 BAL
- BAL/USD CoinMarketCap Ranking: #192
Key Levels
- Resistance: $4.70, $5.00, and $5.50.
- Support: $4.50, $4.00, and $3.50.
The Balancer Market Forecast: Analyzing the Indicators
The reconvergence of the Balancer bulls at the $3.50 price level established the initial higher support level, exerting pressure on the $4.00 resistance level. This action also transformed the former resistance level into the subsequent higher support level. The newly established $4.00 support level is currently amplifying bullish momentum towards the $4.50 resistance price level.
Analyzing the current daily candlestick pattern, the presence of a hammer indicates a bullish sentiment, highlighting the strength and resilience of the bulls. Furthermore, the trade volume indicator reveals a substantial histogram, reinforcing the bullish candlestick’s significance. This pronounced histogram suggests that the bullish trend may persist, potentially advancing towards the $5.00 price level in the near term.
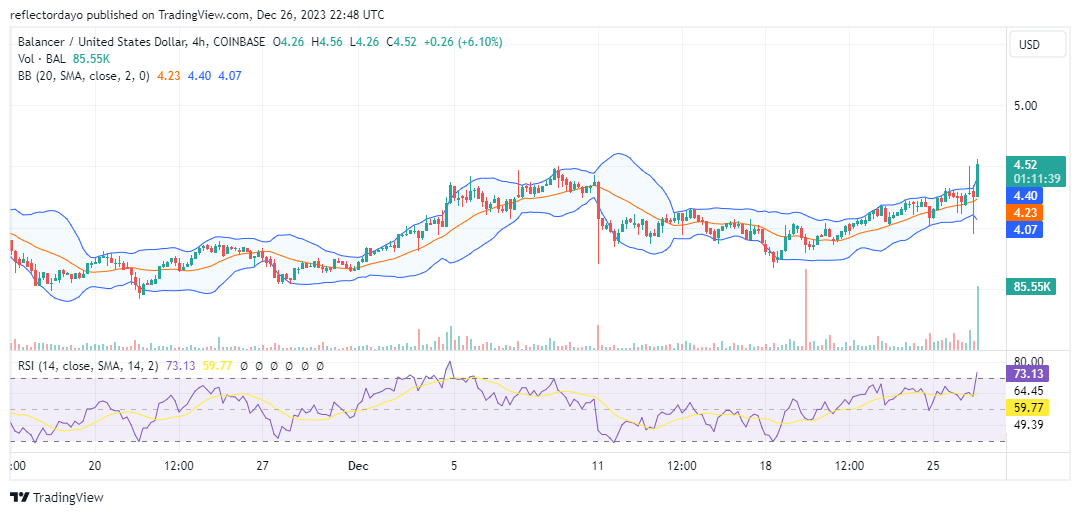
BAL/USD 4-Hour Chart Outlook
The present 4-hour session outlook suggests the emergence of bearish activity, as evidenced by the upper shadow on the candlestick chart. However, this market movement could be interpreted as a mere price correction from the overbought region. The Relative Strength Index (RSI) indicates that persistent demand has propelled the market into overbought territory, necessitating a potential price correction. While the prevailing bullish trend may persist, the bulls must successfully establish the $4.50 price level as support to sustain this momentum.