SPONGE/USD ($SPONGE) Demonstrates Potential for Sustaining the Bullish Trend
Estimated Reading Time: 3 minutes
Don’t invest unless you’re prepared to lose all the money you invest. This is a high-risk investment and you are unlikely to be protected if something goes wrong. Take 2 minutes to learn more
Demand continues to contend with supply at the $0.00011 price level, leading to a prolonged horizontal consolidation within the SPONGE/USD market at this specific price point. An analysis of the trading volume from the past day does not reveal any immediate signs of an impending breakout. Rather, the market seems to be moving closer to an equilibrium state. A more comprehensive market analysis may reveal some promising prospects.
Key Price Levels
- Resistance: $0.000115, $0.000120, and $0.000125.
- Support: $0.000090, $0.000080, and $0.000085.
Sponge (SPONGE/USD) Price Analysis: Technical Insights
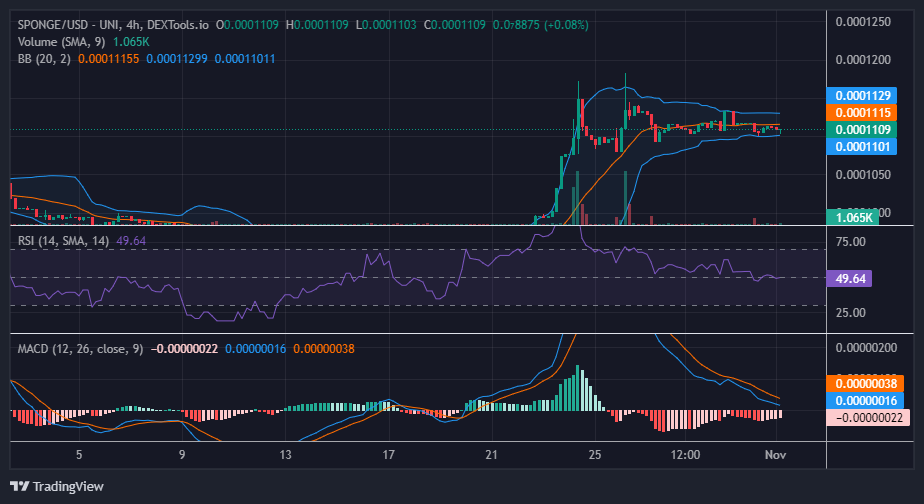
During the second 4-hour trading session of the previous day, the SPONGE/USD bear market exhibited increased strength, driving the price downward toward the critical $0.00011 price level. Notably, this robust bearish movement had no impact on the lower band of the Bollinger Bands indicator, which continued to maintain a horizontal trajectory. The bearish momentum persisted into the third 4-hour session, culminating in a test of the $0.00011 support level. However, the market swiftly rebounded after touching the support level, returning to a state of equilibrium.
This market behavior suggests a potential continuation of sideways trading, as evidenced by the Bollinger Bands’ resilience to price fluctuations.
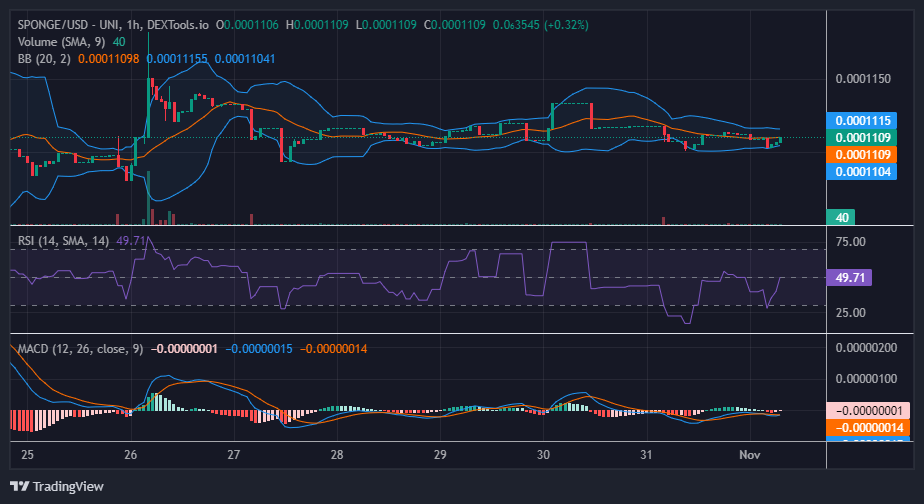
Short-Term Outlook: 1-Hour Chart
However, when analyzing the SPONGE/USD market’s 1-hour chart, an observation reveals that the Bollinger Bands are constricting in response to the price action’s horizontal movement. This narrowing pattern is considered a potential harbinger of an impending price breakout. Traders commonly interpret the convergence of the Bollinger Bands within a horizontally moving price channel as a signal of an upcoming significant price movement or breakout.
The narrower the Bollinger Bands become, the more potential energy is built up within the price, and when the bands eventually expand or widen, it can serve as an indication of the initiation of a new trend or a more substantial price movement. In this particular market, we anticipate a continuation of the upward trend.
Staking for $SPONGE is NOW OPEN! Jump in and begin accumulating passive income!
🎉 The time is finally here, #SPONGERS! 🧽$SPONGE Staking is NOW LIVE! 🚀 Dive in and start earning passive rewards! 🌊💰
Stake your $SPONGE and let the rewards begin! 🎊#SpongeStaking #Crypto #Web3 pic.twitter.com/MjoV2cM5Jv
— $SPONGE (@spongeoneth) November 1, 2023
Invest in the hottest and best meme coin. Buy Sponge ($SPONGE) today!