Ripple (XRP) Continues Its Bearish Run, Pauses above $0.85 Support
Estimated Reading Time: 2 minutes
Don’t invest unless you’re prepared to lose all the money you invest. This is a high-risk investment and you are unlikely to be protected if something goes wrong. Take 2 minutes to learn more
![]()
Ripple (XRP) Long-Term Analysis: Bullish
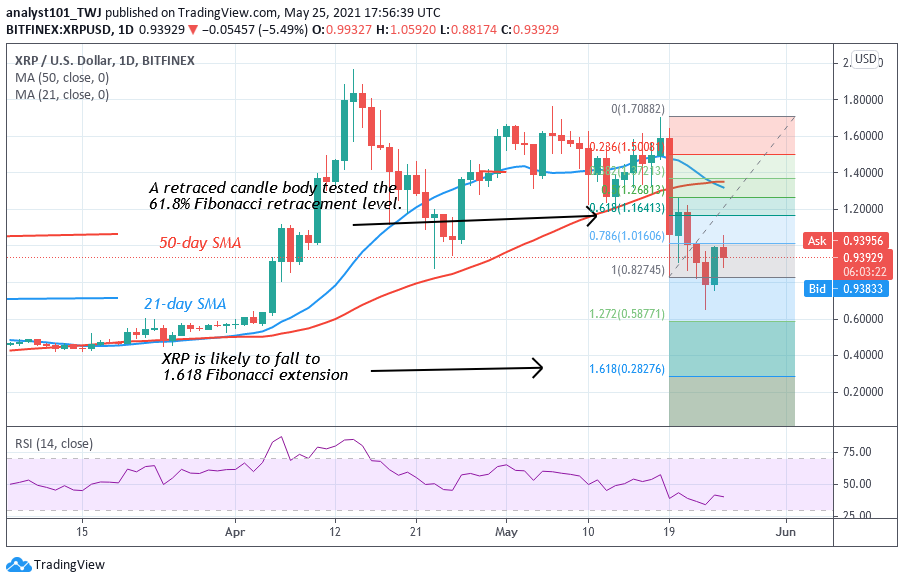
Ripple is retracing after rejection at $1.00. The downward movement will resume if price breaks below the $0.80 support. On May 19 downtrend; a retraced candle body tested the 61.8% Fibonacci retracement level. The retracement indicates that XRP is likely to fall to 1.618 Fibonacci extension or level $0.28. Presently, XRP is trading and hovering above $0.85 support.
Ripple (XRP) Indicator Analysis
XRP/USD is at level 40 of the Relative Strength index period 14. It indicates that XRP is in the downtrend zone below the centerline 50. XRP is capable of falling on the downside. The coin is below the moving averages which suggest a possible downward move. Ripple is below 80% range of the daily stochastic. It indicates that the market is in the bearish trend zone.

Technical indicators:
Major Resistance Levels – $2.00, $2.50, $3.00
Major Support Levels – $1.50, $1.00, $0.50
What Is the Next Direction for Ripple (XRP)?
Ripple has fallen to the low of $0.65 as price corrected upward. The upward correction has been stalled at the recent high. The retracement has found support above the 21-day SMA. On May 19 downtrend; a retraced candle body tested the 61.8 % Fibonacci retracement level. The retracement indicates that the market will fall to level 1.618 Fibonacci extension or level $0.29.

Note: new.cryptosignals.org is not a financial advisor. Do your research before investing your funds in any financial asset or presented product or event. We are not responsible for your investing result