Compound (COMPUSD) Keeps Fluctuating as Price Narrows Through a Triangle
Estimated Reading Time: 3 minutes
Don’t invest unless you’re prepared to lose all the money you invest. This is a high-risk investment and you are unlikely to be protected if something goes wrong. Take 2 minutes to learn more
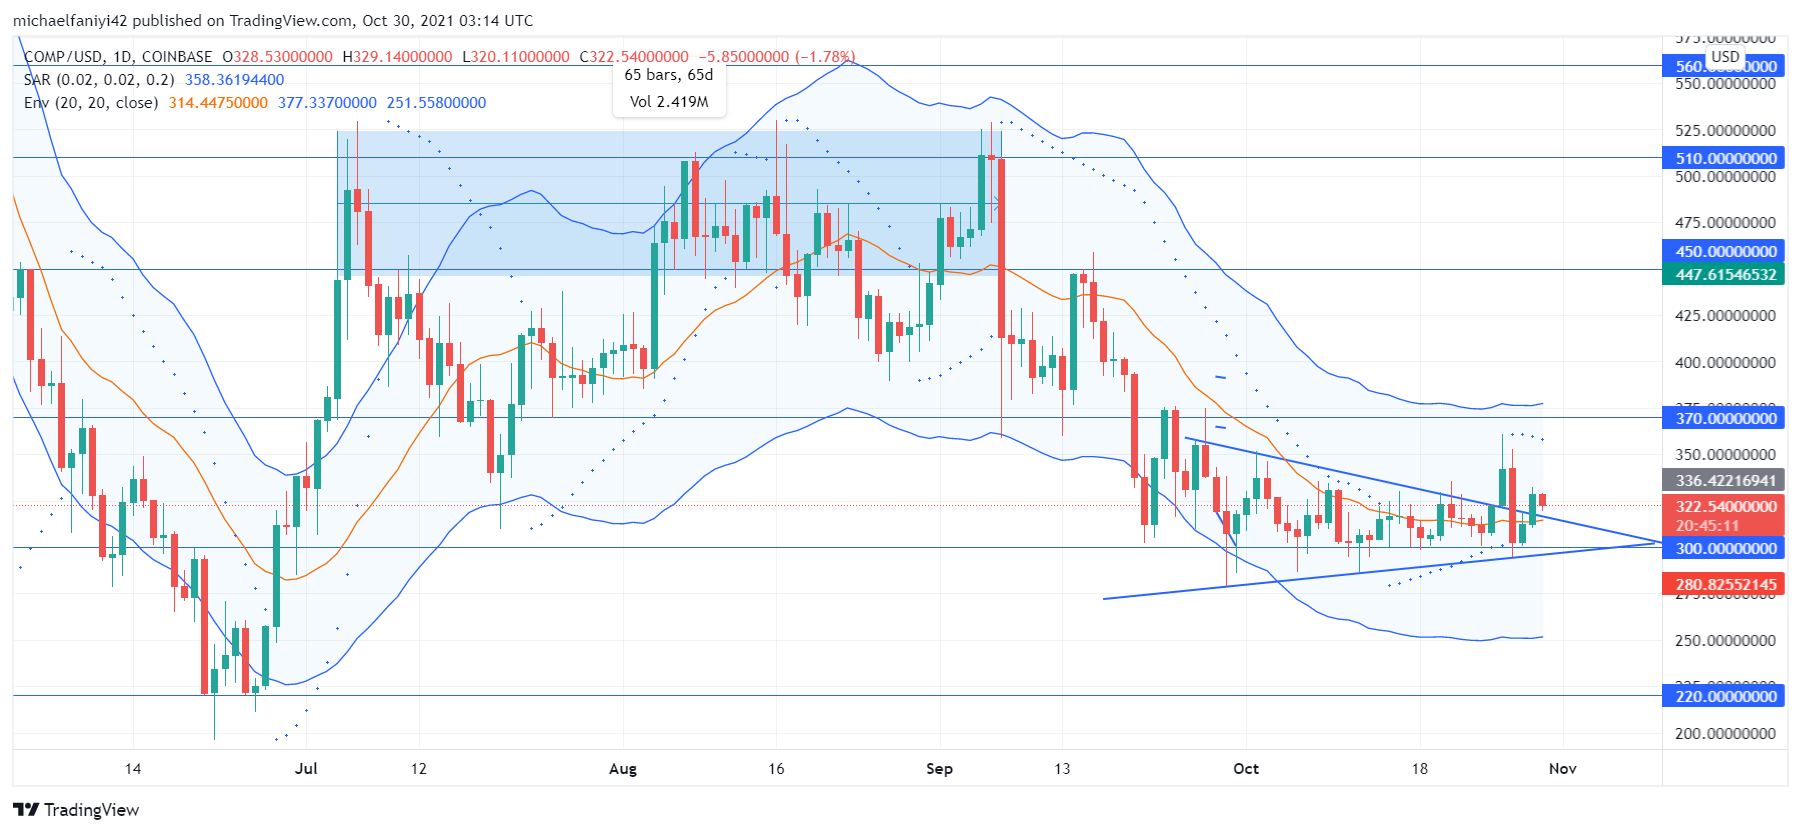
Compound Analysis – Price Keeps Fluctuating Around the $300 Key Level
Compound keeps fluctuating around the $300 price level as it narrows into a triangle pattern. Bears have been acting on the market from the $510 resistance level. This dropped the coin to the $370 price level. Every effort by the bulls to bring the market back upward was quelled when price dropped further to the $300 significant level. Since then, Compound has been fluctuating at this level.
Compound Critical Levels
Resistance Levels: $510, $370
Support Levels: $300, $220
The market began being bullish after falling to a low of $220. It rose rapidly through many key levels to reach the resistance at $510, which forcefully repelled it. Price falls around $370, where bulls revived to lift the market again. But again, the coin could not breach $510. Thereafter, Compound keeps fluctuating below the resistance level and testing it, but the level remains impervious. Bears have now successfully plunged the market.
After 65-days of failing to breach the $510 resistance level, Compound begins a continuous fall with lower lows and highs. Price eventually drops to $300. At this point, bulls have risen again to claim the market, and this has left the market fluctuating, even as price tapers into a triangle pattern. Four days ago, the coin had a false breakout as the coin rose and dropped instantly back into the triangle. The coin is now trying to break out again and has dropped to retest the triangle’s upper border.

Market Prospect
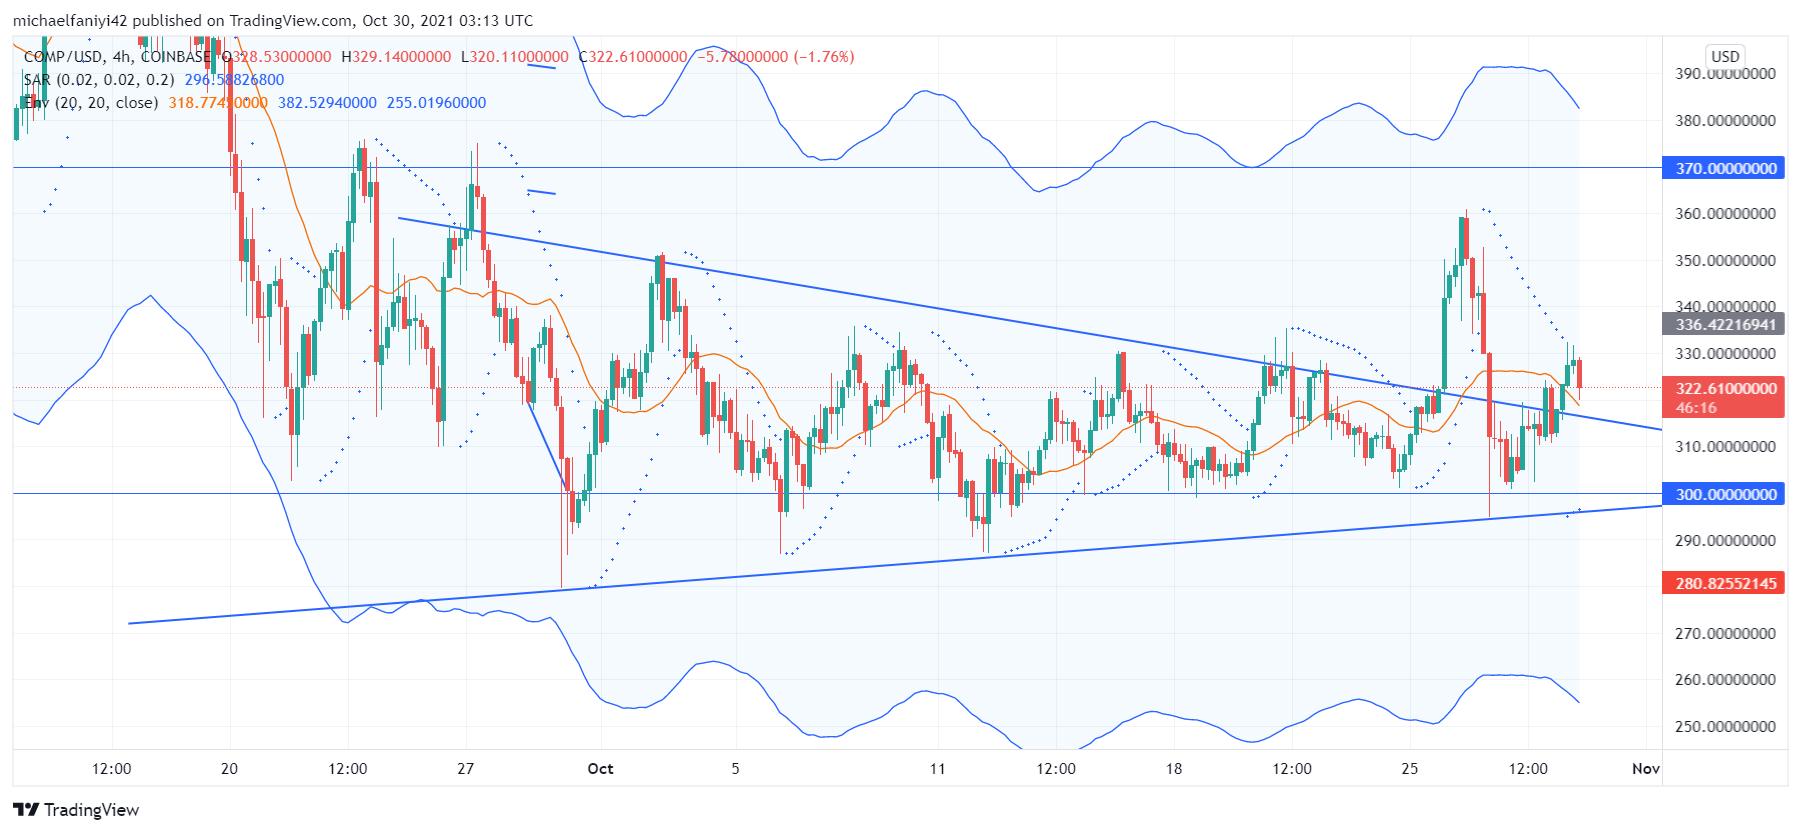
On the 4-hour chart, the market is now making another concerted effort to break out of its triangle formation. In doing this, the coin has broken above the EMA of the envelope and is retracting to retest it before further upward movement. The Parabolic SAR (Stop and Reverse) also displays the same bullish market sentiment. It has now aligned 3 dots below the 4-hours candlesticks to indicate an upturn in market movement.
The coin is expected to bounce off the upper border of the triangle pattern and reach beyond $370.
You can purchase crypto coins here: Buy Tokens
Note: Cryptosignals.org is not a financial advisor. Do your research before investing your funds in any financial asset or presented product or event. We are not responsible for your investing results.