The Graph (GRT/USD): Bullish Momentum Appears Sustainable
Estimated Reading Time: 2 minutes
Don’t invest unless you’re prepared to lose all the money you invest. This is a high-risk investment and you are unlikely to be protected if something goes wrong. Take 2 minutes to learn more
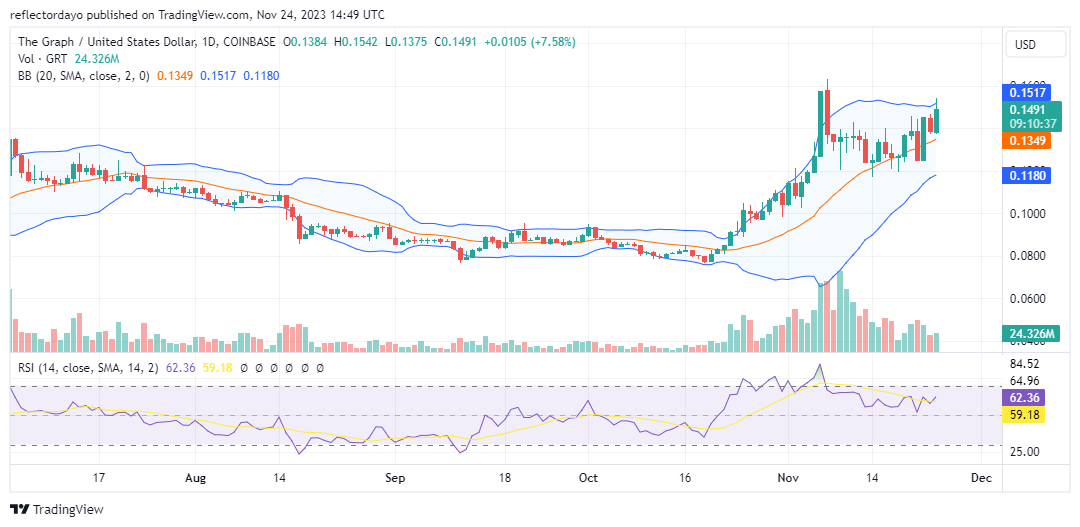
In the latter half of October, The Graph entered a noteworthy bullish phase, consistent with broader trends in the cryptocurrency market. Following a period of approximately two and a half months characterized by sideways movement around the $0.08 price level, a protracted struggle between bulls and bears ensued. The turning point came on October 20, when bulls initiated an upward drive. However, the bullish momentum encountered resistance at the $0.16 price level on November 7.
The Graph Market Data
- GRT/USD Price Now: $0.1515
- GRT/USD Market Cap: $1,392,200,133
- GRT/USD Circulating Supply: 9,313,736,521 GRT
- GRT/USD Total Supply: 10,785,265,980 GRT
- GRT/USD CoinMarketCap Ranking: #45
Key Levels
- Resistance: $0.16, $0.17, and $0.18.
- Support: $0.14, $0.13, and $0.12.
The Graph Market Price Forecast: Analyzing the Indicators
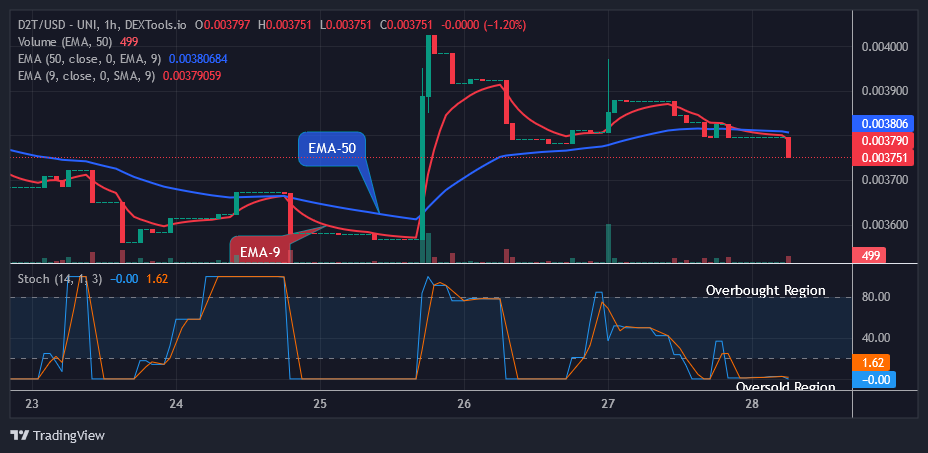
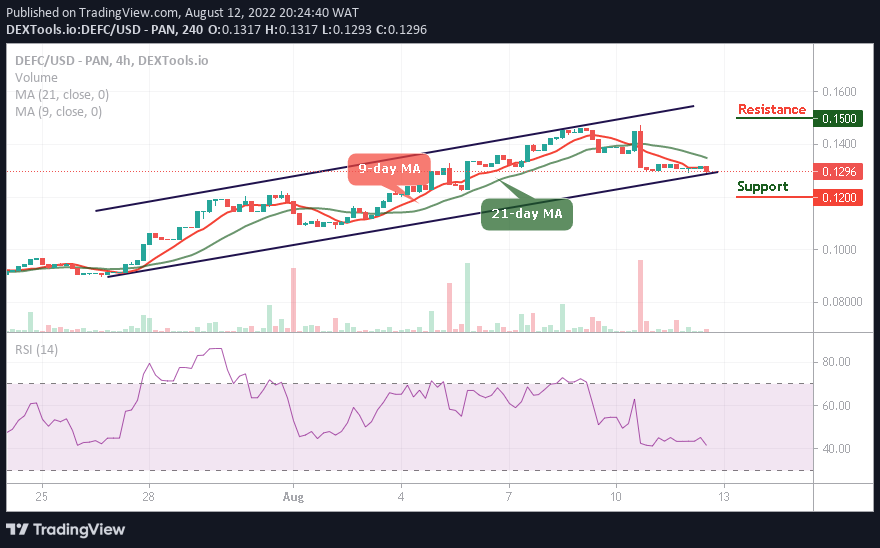
A pronounced bear market ensued following the market’s reach of the $0.16 price level. However, The Graph bullish intervention occurred at the $0.12 price level, aiming to rescue the upward market trend. Despite substantial volatility, the market maintained a sideways trajectory, characterized by a wide bandwidth within the price channel. Presently, the market has established a higher support level at $0.1378, and there is an ongoing pursuit to reach the $0.16 price level.
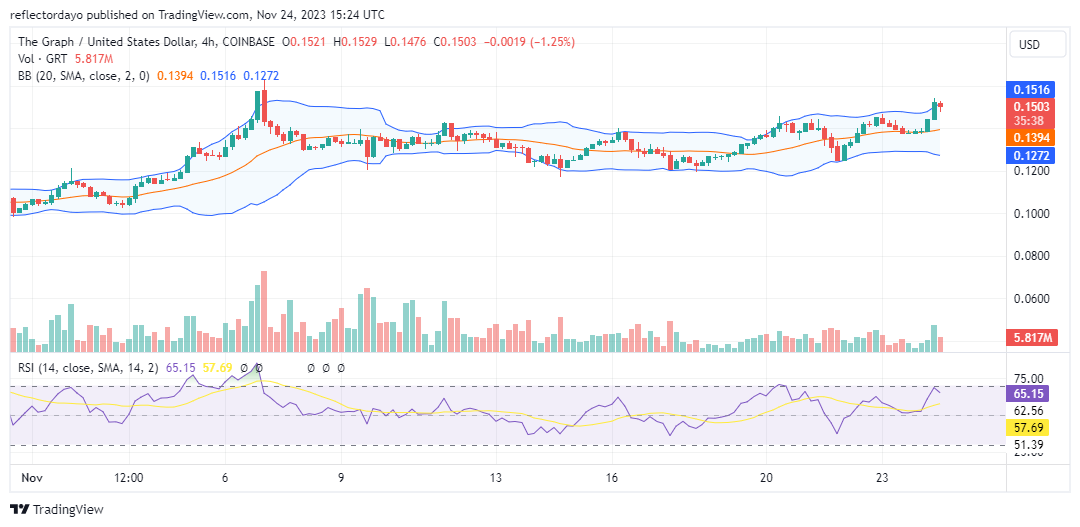
GRT/USD 4-Hour Chart Outlook
Analyzing the market through the 4-hour chart, clear bullish signals are evident, raising the potential for the market to attain the $0.16 price target. Despite encountering resistance at $0.144, the market has successfully breached this barrier, and the price is currently approaching the $0.16 price level. The prospect of the market reaching a high of $0.16 appears plausible.