Fetch.ai (FET/USD) Is Set to Retrace to the Yearly High of $0.600
Estimated Reading Time: 2 minutes
Don’t invest unless you’re prepared to lose all the money you invest. This is a high-risk investment and you are unlikely to be protected if something goes wrong. Take 2 minutes to learn more
On February 8, the Fetch.ai market reached its annual peak at $0.600, initiating a sustained period of downward trading that ultimately stabilized around the $0.20 price mark in June. Buyers intervened at the $0.20 level to mitigate the bearish momentum. However, the ensuing conflict between demand and supply led to a consolidation phase at this price level, persisting until the latter half of October. During this period, bullish sentiment prevailed, propelling the price to a resurgence, culminating in a rally towards $0.60.
Fetch.ai Market Market Data
- FET/USD Price Now: $0.54
- FET/USD Market Cap: $441,175,870
- FET/USD Circulating Supply: 812,503,130 FET
- FET/USD Total Supply: 1,152,997,575 FET
- FET/USD CoinMarketCap Ranking: #100
Key Levels
- Resistance: $0.6, $0.65, and $0.70.
- Support: $0.45, $0.40, and $0.35.
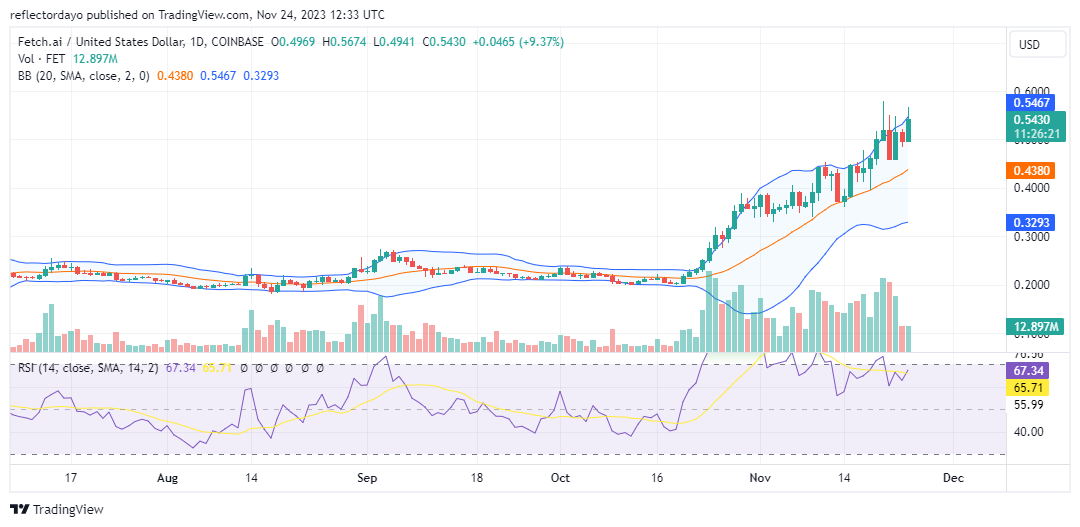
Fetch.ai Market Price Forecast: Analyzing the Indicators
The indicators are signaling a robust bullish trend. The Bollinger Bands indicator depicts an ascending price channel marked by volatility, accompanied by ample supply that empowers buyers to propel the price toward the $0.6 target. The trading volume indicator also indicates a heightened level of trading activity, with an influx of Fetch.ai traders participating in the bullish market, driving the price towards the target. However, as the price approaches the target, there appears to be diminishing bullish momentum, as evidenced by the upper shadows observed on recent candlesticks in the chart.
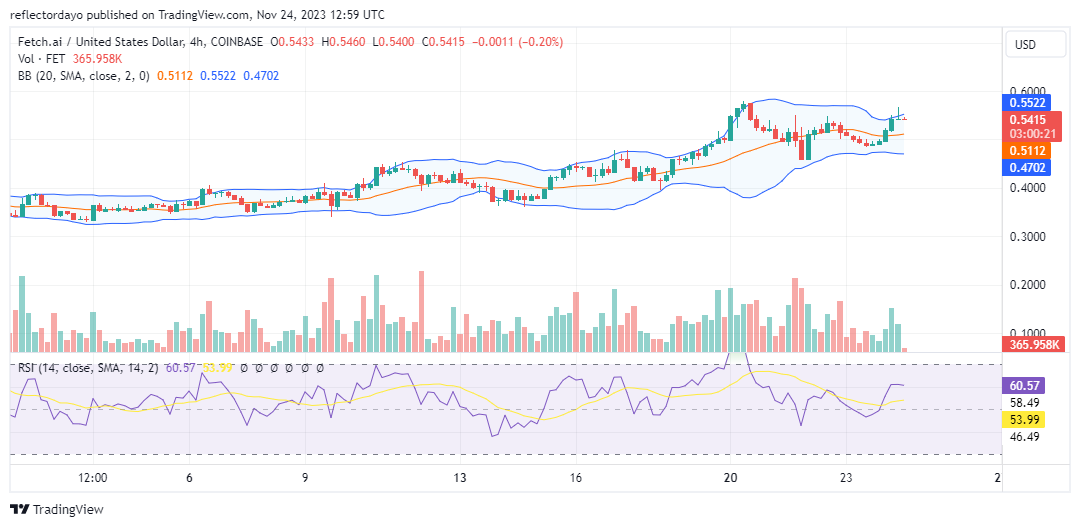
FET/USD 4-Hour Chart Outlook
The 4-hour chart also illustrates a bullish market, although the influence of bearish forces is noticeable as, at certain junctures, the price action exhibits sideways movement. Fetch.ai bearish traders seem to intervene around the $0.575 price level, attempting to curtail the bullish momentum. Nevertheless, the prevailing sentiment in the market appears to be predominantly bullish.