Polkadot Is Drifting Sideways as It Holds above $5.50
Estimated Reading Time: 2 minutes
Don’t invest unless you’re prepared to lose all the money you invest. This is a high-risk investment and you are unlikely to be protected if something goes wrong. Take 2 minutes to learn more
Polkadot (DOT) Long-Term Analysis: Bearish
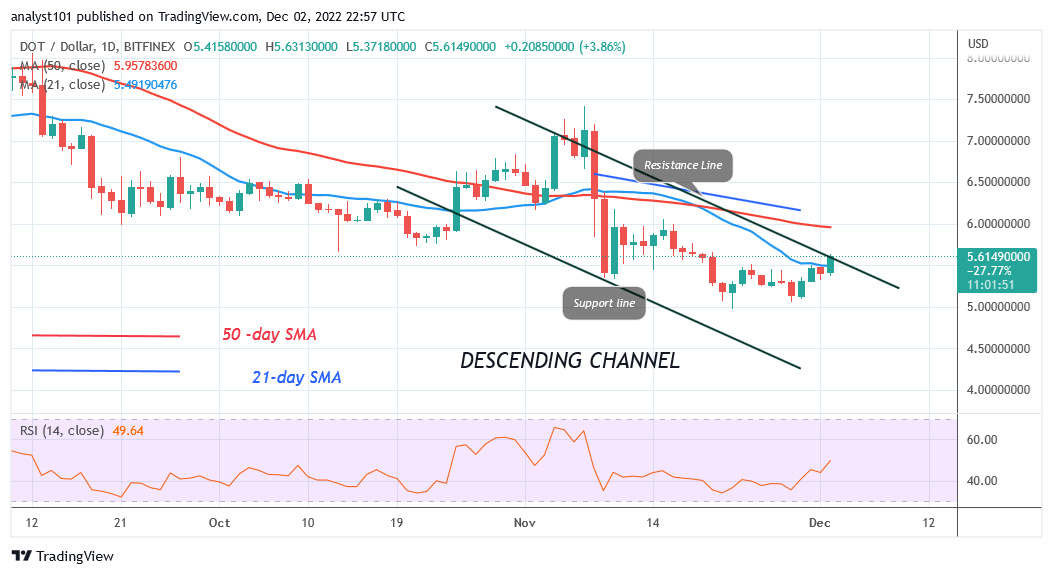
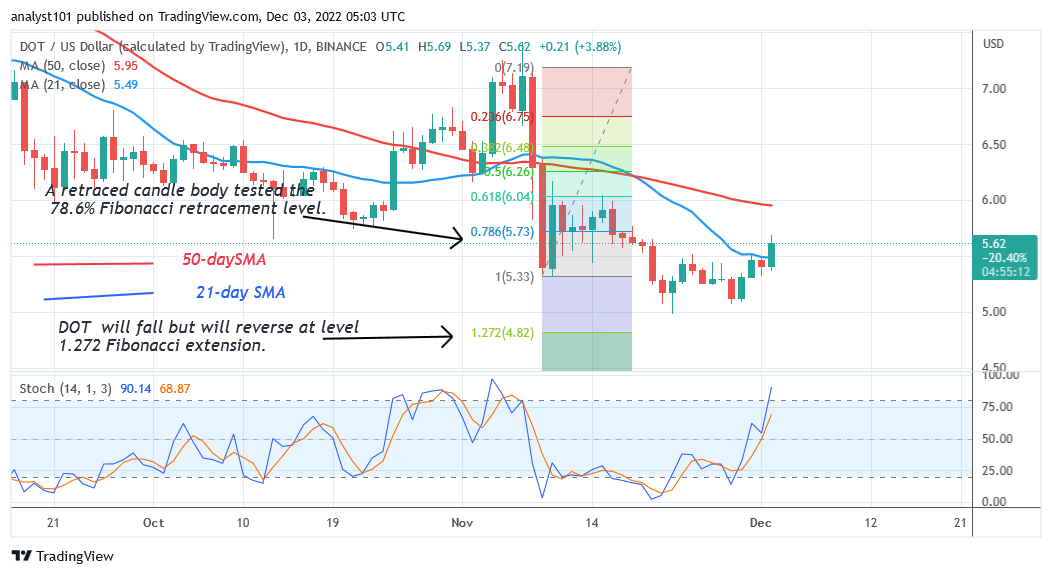
Polkadot (DOT) is currently on an upward correction as it holds above $5.50. Though it failed to cross the 50-day line SMA, the DOT price has broken over the 21-day line SMA. The crypto’s price has been oscillating between the moving average lines for the last 48 hours. The altcoin will return to the $ 7.41 high if buyers retain the price above the 50-day SMA. If sellers breach the 21-day line SMA, the DOT price will drop, and the selling pressure will return. The price of the cryptocurrency will sag to $5.34. DOT/USD is currently trading at $5.58 and is pinned between the moving average line.
Polkadot (DOT) Indicator Analysis
The DOT price is at level 49 on the Relative Strength Index for period 14. It implies that there is an equilibrium between supply and demand. The cryptocurrency’s price has risen above the 21-day SMA. A range-bound move will begin if Polkadot holds its position above the 21-day line SMA. The altcoin is in a bullish trend when its daily Stochastic indicator is above 68.
Technical indicators:
Major Resistance Levels – $10, $12, $14
Major Support Levels – $8, $6, $4
What Is the Next Direction for Polkadot (DOT)?
Polkadot has recovered at the bottom of the chart as it holds above $5.50.The value of the cryptocurrency has increased and it is now in the overbought zone. The DOT price is currently drifting sideways between moving average lines. The altcoin will trend once the range-bound levels are broken.
You can purchase crypto coins here. Buy LBLOCK
Note: Cryptosignals.org is not a 1a financial advisor. Do your research before investing your funds in any financial asset or presented product or event. We are not responsible for your investing results