Bitcoin (BTC/USD) Price Loses Valuation
Estimated Reading Time: 3 minutes
Don’t invest unless you’re prepared to lose all the money you invest. This is a high-risk investment and you are unlikely to be protected if something goes wrong. Take 2 minutes to learn more
Bitcoin Price Prediction – January 23
There has been a significant reduction in the BTC/USD market activities as the crypto-economic price loses valuation to the downside spot t trade around $35,696 within the higher value line of $35,841 and a lower point of about $34,906 as of writing. The market’s percentage rate is at 1.42 positives.
BTC/USD Market
Key Levels:
Resistance levels: $37,500, $40,000, $42,500
Support levels: $32,500, $30,500, $27,500
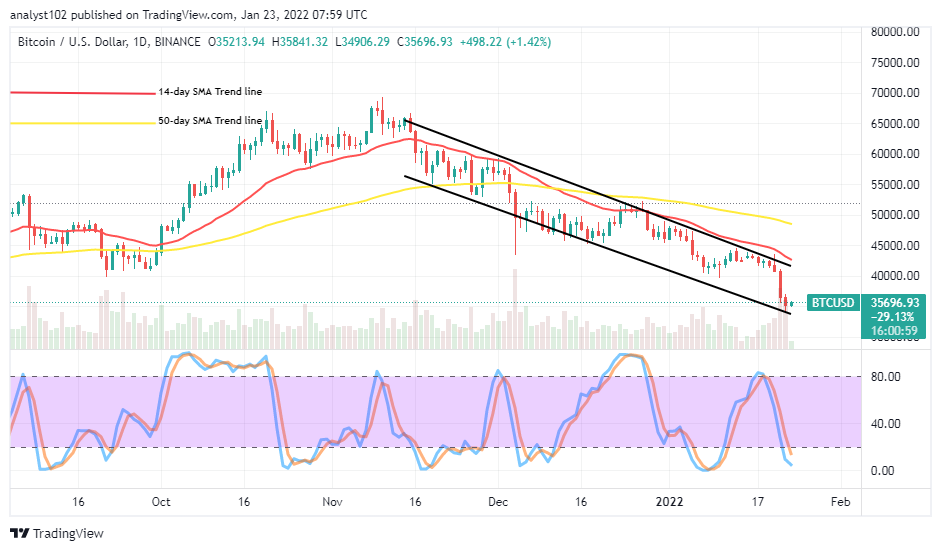
BTC/USD – Daily Chart
The BTC/USD market price loses valuation at the successful breakdown of the $40,000 on January Friday 21 sessions as shown on the daily trading chart. The 14-day SMA indicator is underneath the 50-day SMA indicator. The bearish channel trend lines drew southward, finding variant strategic trading levels around $40,000 as the resistance and $35,500 as the support. The Stochastic Oscillators are in the oversold region closely, seemingly trying to curve their lines back northbound within it. That signifies the probability of getting a rallying motion against the current declining force.
Can long-position takers count upon the rallying possibility motion in the BTC/USD market as the crypto-economic price loses valuation significantly?
As there has been that the BTC/USD market price loses valuation significantly to a lower-trading tune of around $35,000, long-position takers may cautiously count upon a rallying motion possibly to resurface from beneath the value-line for a while. In the process of price reversing against the situation, the price may systemically resume a declining movement to rebuild on a new support trading spot.
On the downside of the technical analysis, the BTC/USD market short-position takers may have to slow down in exerting a position around the $35,000 trading level for a while. That assumption is from the technical reading of the current Stochastic Oscillators positioning in the oversold trading region. The downward momentum to the southbound side now appears, getting exhausted on a gradual mote.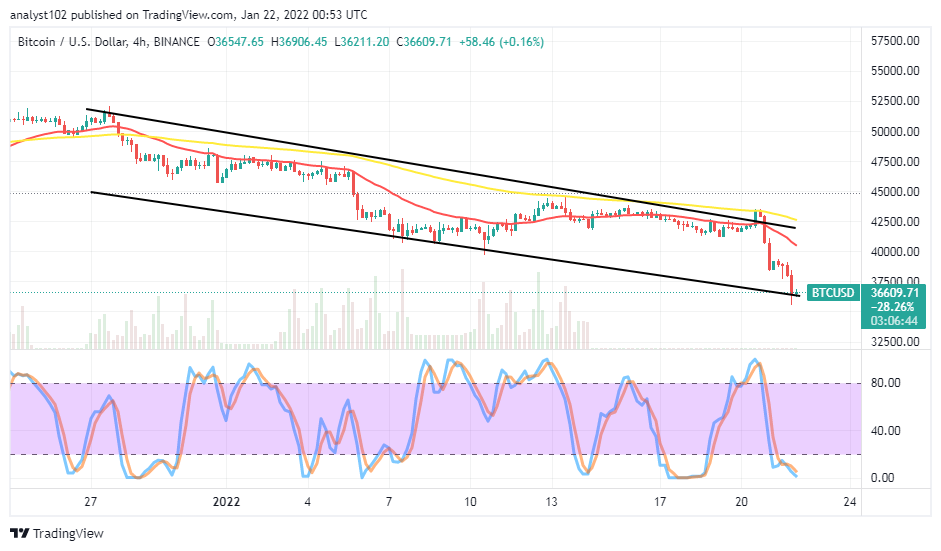
BTC/USD 4-hour Chart
The BTC/USD 4-hour chart shows the crypto-economic price loses valuation to trade around the lower bearish channel trend line drew briefly placed a bit past the $35,500 level. The 50-day SMA indicator is above the 14-day SMA indicator. The Stochastic Oscillators have crossed their lines northbound a bit, nearing the range of 80. The current formation of variant candlesticks shows an outlook of price convergences a bit over the value line mentioned earlier. The main resistance trading zones remain around the $37,500 and $40,000 levels.
Note: Cryptosignals.org is not a financial advisor. Do your research before investing your funds in any financial asset or presented product or event. We are not responsible for your investing results.
You can purchase crypto coins here. Buy Tokens