Litecoin (LTC/USD) Witnesses an Upsurge Past the Bearish Path-Trend
Estimated Reading Time: 3 minutes
Don’t invest unless you’re prepared to lose all the money you invest. This is a high-risk investment and you are unlikely to be protected if something goes wrong. Take 2 minutes to learn more
Litecoin Price Prediction – April 6
Yesterday recorded a visible breakout of the LTC/USD bearish path-way ever featured since the start of the bullish run of this crypto-trade.
LTC/USD Market
Key Levels:
Resistance levels: $240, $260, $280
Support levels: $180, $160, $140
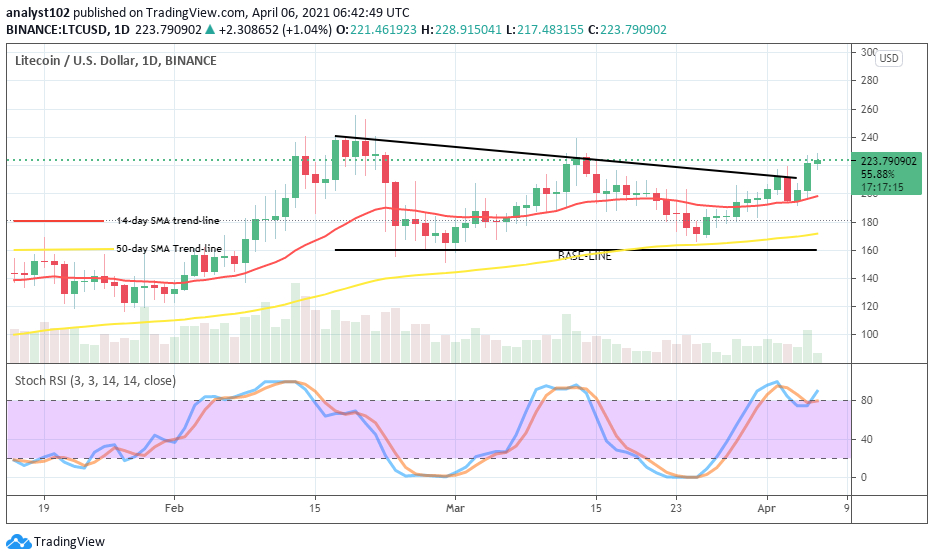
LTC/USD – Daily Chart
The daily LTC/USD trading chart now showcases a strong buying signal ideally to give a more promising upsurge in the market activities in near sessions. In a continuation increasing bid, a bullish candlestick appears forming around the $200 resistance zone. The 14-day SMA trend-line is located underneath the current market trading point above the 50-day SMA indicator. The Stochastic Oscillators are around the range 80 crossing the hairs towards the northbound. That signifies that some buying pressures are ongoing.
Will the LTC/USD worth now keep on an increasing note?
Having had a well-formed bullish candlestick against the critical point of $200 level, the LTC/USD bulls are now expected to strengthen momentum on that hike in the next trading sessions. The resistance level of $220 is in focus as more buying pressures will have to be exerted to let a better stance-stride of the bulls in the market play out successfully afterward.
On the downside, this crypto-trade will have to let encounter a tangible resistance line coupled with a bullish loss momentum at a high trading zone before the bears may begin to look out for a sell order. However, being as it is, that market scenario may not cheaply emerge very soon in the near time. Therefore, it calls for a serious precautionary trading psych while watching out for a sell position.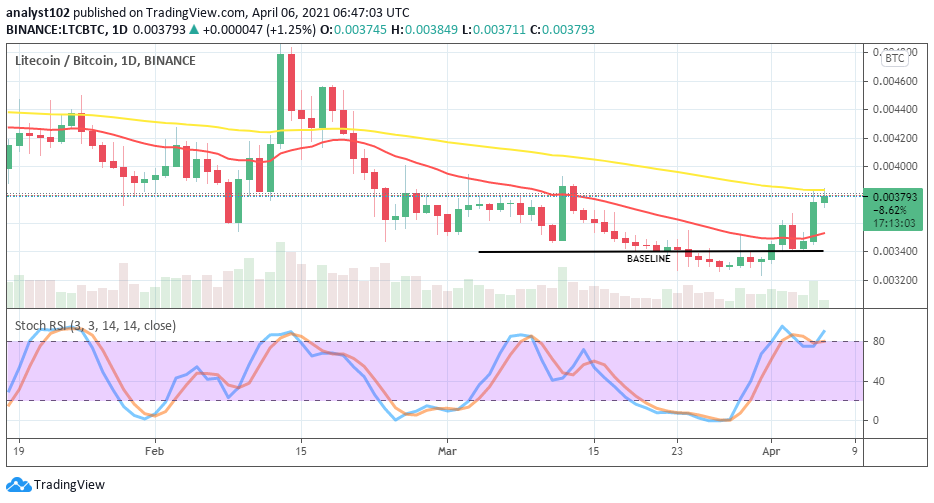
LTC/BTC Price Analysis
It is now apparent that weighing the purchasing degree between LTC and BTC, the base crypto has embarked on regaining energy having badly suffered some levels of pressure by the counter crypto. Nevertheless, LTC as the base hasn’t been able to push vividly out of the pressure as of writing. Price has only touched the 50-day SMA trend-line from the below as the 14-day SMA is under it. The stochastic Oscillators have placed around range 80 to briefly cross the hairs to the north. That gives a signal that the base crypto is on intensifying its position against the counter trading instrument.
Note: cryptosignals.org is not a financial advisor. Do your research before investing your funds in any financial asset or presented product or event. We are not responsible for your investing results.