Enjin Coin Enters Critical Squeeze
Estimated Reading Time: 3 minutes
Don’t invest unless you’re prepared to lose all the money you invest. This is a high-risk investment and you are unlikely to be protected if something goes wrong. Take 2 minutes to learn more

Price Analysis – Bullish Accumulation Meets Short-Term Selling Pressure
Enjin Coin price forecast reveals a market at a critical inflection point, coiled in a tight consolidation that signals an impending volatility breakout. A Bollinger Band Squeeze on the daily chart indicates a major directional move is forthcoming. While this long-term pattern is underpinned by signs of bullish accumulation, it faces immediate headwinds from short-term corrective selling pressure.
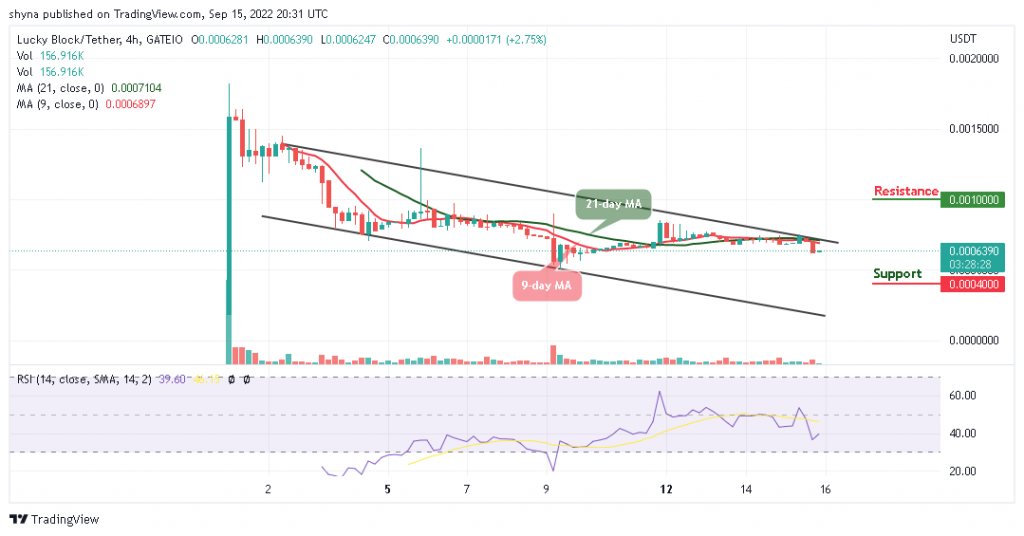
Enjin Coin Key Levels
Support Levels: $0.0564 $0.0430
Resistance Levels: $0.0728, $0.0916

The daily chart for ENJ/USD shows a market that has been consolidating for the past month, leading to a significant contraction of the Bollinger Bands. This squeeze is the dominant technical pattern, indicating that volatility is at a critical low point and the market is gathering energy for its next major trend.
The price is currently hovering around the 20-day moving average, a sign of perfect equilibrium. While the price action is flat, the Money Flow Index (MFI) provides a bullish clue. With a reading of 60.13, the MFI is comfortably above the 50 midline. This suggest that despite the lack of price movement, there has been a net positive money flow (accumulation) over the recent period. This hints that the eventual resolution of the squeeze may favor the bulls.
The price is now showing signs of bouncing from the lower Bollinger Band, which is acting as dynamic support. This is where the long-term accumulators may be absorbing the short-term selling pressure, creating the current battle in the market. The resolution of the daily squeeze will likely be determined by whether this support holds.

Market Expectation
The 4-hour chart provides a more immediate view of the conflicting pressures. It shows a clear corrective move since the price peaked around September 14th. The price, currently at $0.0705, has fallen from the upper Bollinger Band to the lower band, completing a short-term bearish rotation. This pullback is confirmed by the Money Flow Index (MFI), which has dipped below the 50 midline to 44.10. This indicates that money flow has turned negative in the short term as traders take profits.
You can purchase Lucky Block here. Buy LBLOCK
Note: Cryptosignals.org is not a financial advisor. Do your research before investing your funds in any financial asset or presented product or event. We are not responsible for your investing results