Tamadoge (TAMA/USD) Remains Poised for Bullish Action Around the $0.0001 Support Zone
Estimated Reading Time: 3 minutes
Don’t invest unless you’re prepared to lose all the money you invest. This is a high-risk investment and you are unlikely to be protected if something goes wrong. Take 2 minutes to learn more
Recently, the TAMA/USD market has experienced persistent bearish pressure, prompting bulls to retreat and consolidate around the $0.0001 price level. Initially, the price held steady at this level for several trading sessions, indicating a period of accumulation. This was followed by a breakout, with the market surging toward the $0.00015 resistance zone. However, bullish momentum was capped around the $0.000144 level, triggering a pullback that has returned the price to a critical support area near $0.00011. Despite the setback, this zone remains a key level to watch for potential bullish resurgence.
Key Levels to Watch
- Resistance Zones: $0.00045, $0.00050, $0.00055
- Support Zones: $0.00010, $0.00009, $0.00008

Tamadoge 4-Hour Chart: Technical Indicators Point to Potential Reversal
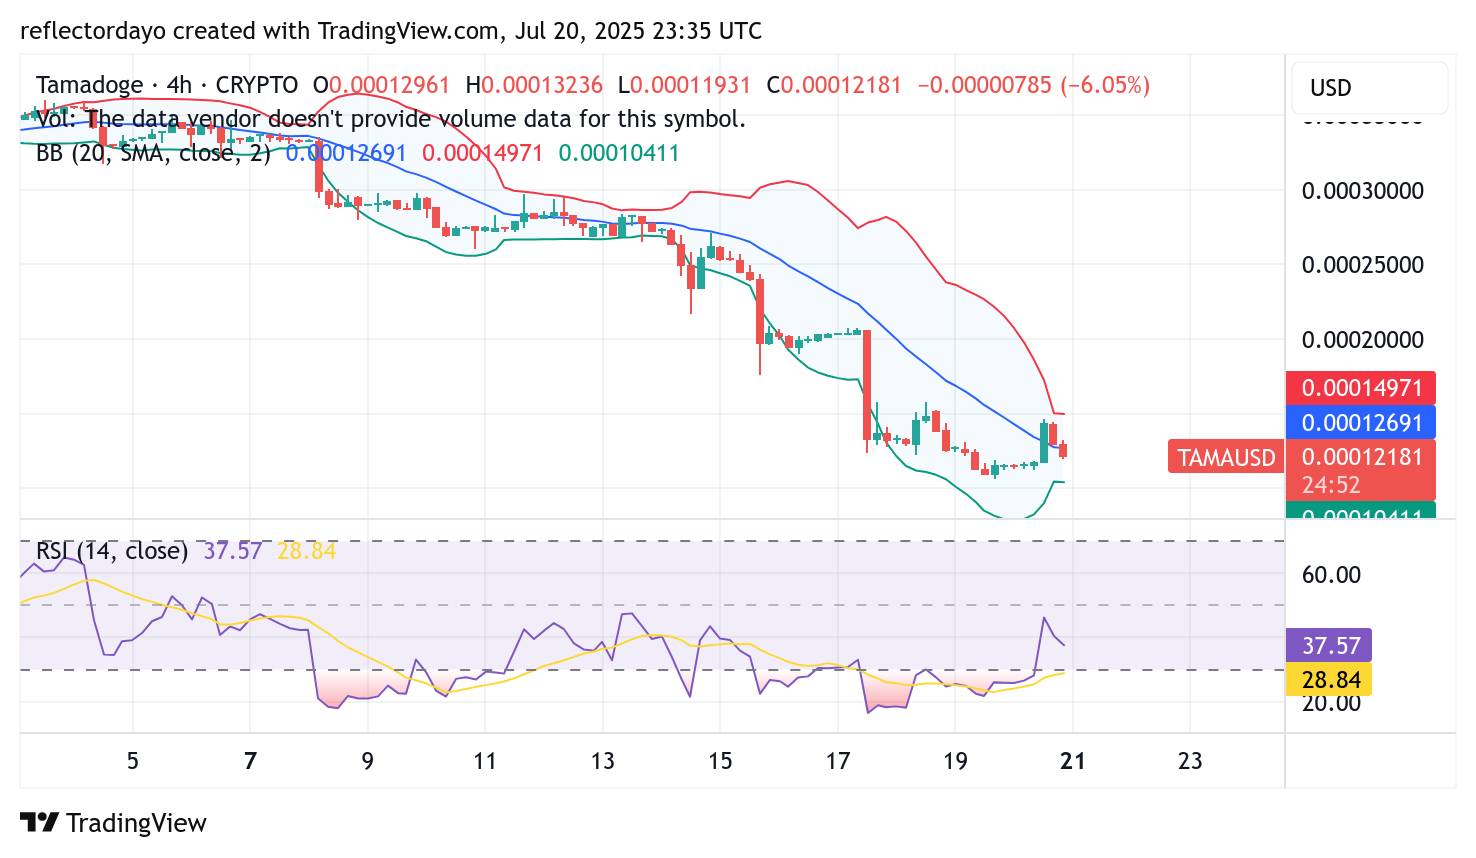
The recent attempted rally in Tamadoge (TAMA/USD) was short-lived, as the market rebounded from the $0.00011 support zone and surged toward the $0.00015 level, only to lose momentum near $0.000144. This brief upswing had little impact on the overall bearish trend that continues to dominate the market. However, the strong buying interest observed around the $0.00011 level suggests that traders view this price point as a strategic entry zone, contributing to a growing bullish bias. Signs of accumulation are becoming evident, and the recent upward movement hints that the market may be preparing for a potential bullish reversal.
TAMA/USD 1-Hour Chart: Bullish Prospects Build as Support Holds Firm
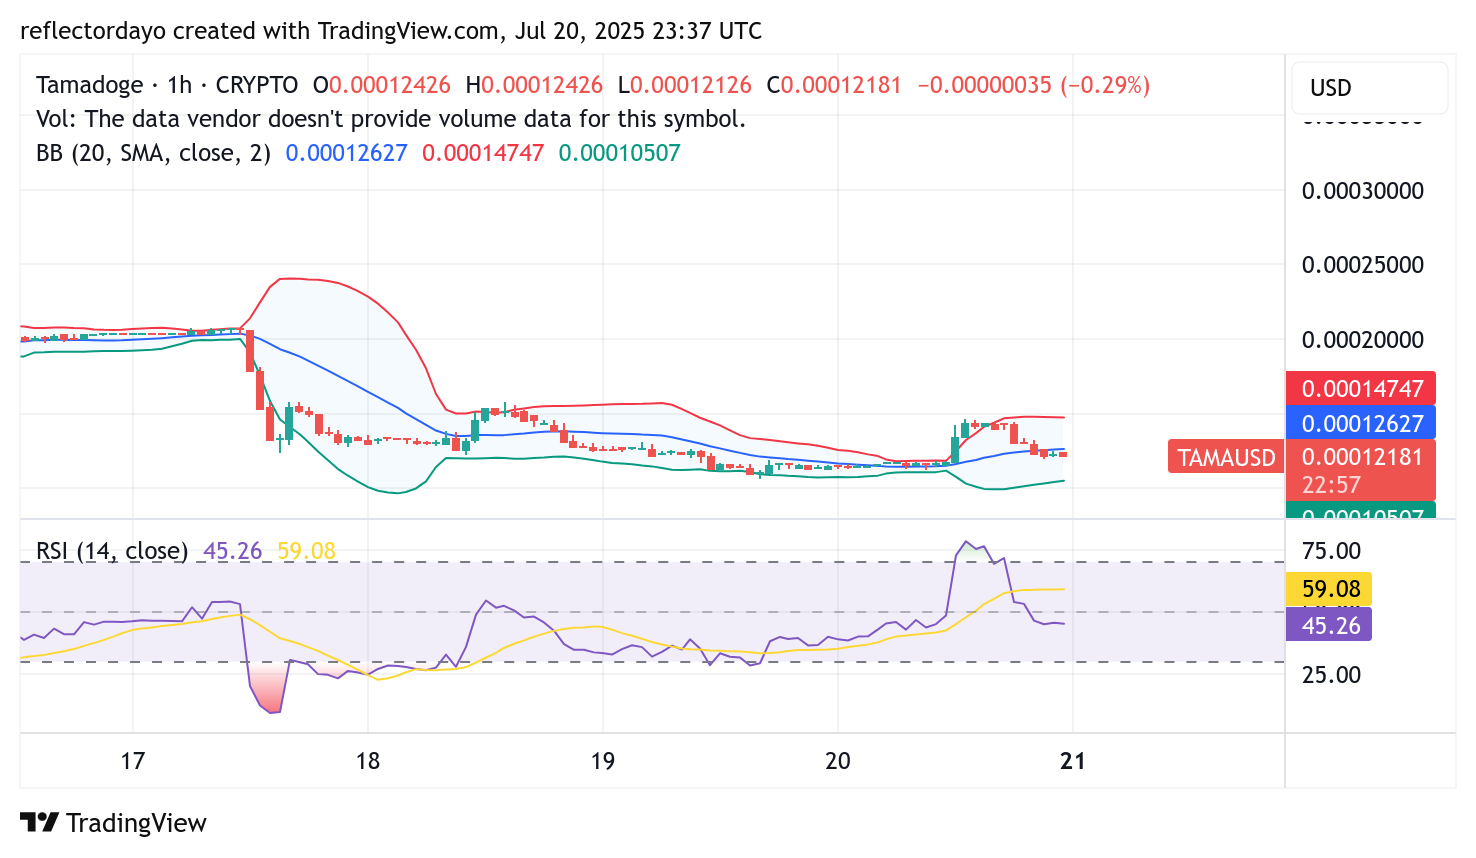
The TAMA/USD market currently trades around the $0.00012 level, a key area of equilibrium where both bullish and bearish forces appear balanced. Despite this standoff, bullish dominance remains evident. If buyers continue to hold their ground against bearish pressure, this zone may solidify into a reliable support level—potentially paving the way for a bounce to the upside. At present, price stability at this level reflects market indecision, but the underlying bullish sentiment suggests a possible shift in momentum.
Buy Tamadoge!
There’s no mobile runner out there quite like #TamadogePursuit! 🏃♂️
1️⃣ Sign up – start with 20 free credits for a boost!
2️⃣ Climb up the leaderboards.
3️⃣ Win $TAMA rewards!Play Now! 👇
📱Android: https://t.co/Of8SYALRzL
📱 iOS: https://t.co/IthvqovwAH pic.twitter.com/84HNqob9Rf— TAMADOGE (@Tamadogecoin) September 10, 2024