Bitcoin Cash (BCH/USD) Trade Keeps in a Low-Trading Outlook
Estimated Reading Time: 3 minutes
Don’t invest unless you’re prepared to lose all the money you invest. This is a high-risk investment and you are unlikely to be protected if something goes wrong. Take 2 minutes to learn more

Free Crypto Signals Channel
Bitcoin Cash Price Prediction – February 25
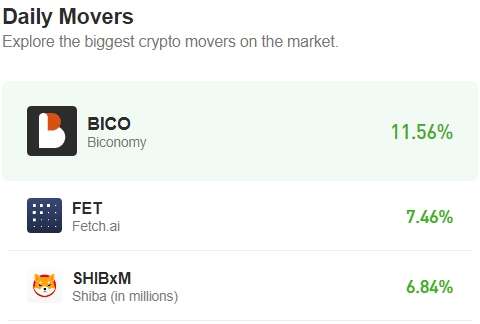
It has overly observed that the market movers have not been making volatility in the BCH/USD market operations as the crypto-economic trade keeps in a low-trading outlook. The crypto economy has increased and decreased, giving $304 and $290 points at a minute positive percentage rate of 0.82 as of writing.
BCH/USD Market
Key Levels:
Resistance levels: $350, $400, $450
Support levels: $250, $200, $150
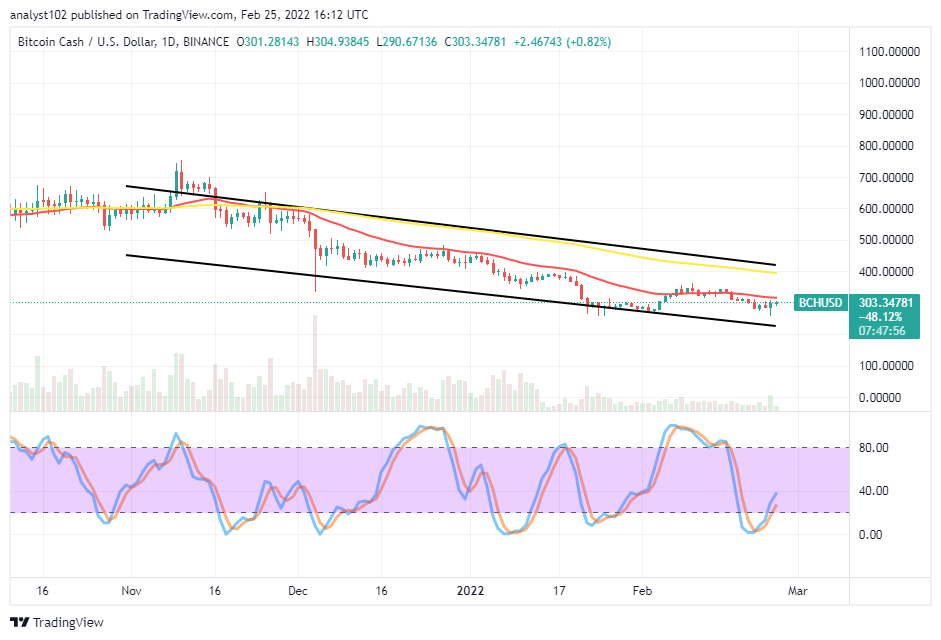
BCH/USD – Daily Chart
The BCH/USD daily chart showcases the crypto-economic keeps in a low-trading outlook in its approaches. There has been a continued featuring of variant candlesticks closely beneath the trend line of the smaller SMA. The 50-day SMA indicator is underneath the 14-day SMA indicator. The Stochastic Oscillators have crossed northbound from the oversold region to touch the range of 40. That reading raises an indication suggesting a buying force to play out in the crypto economy.
Is the BCH/USD market operation worth placing orders on as the crypto-economic keeps in a low-trading outlook?
On the higher trading time frame, placing orders on the BCH/USD market operation appears difficult. The crypto-economic trade keeps featuring in a low-trading outlook force over long-several sessions. Long-position takers still needed to exercise patience to get another round of oversold conditions that will be by the Stochastic Oscillators to reconsider going for a long order.
On the downside of the technical analysis, the BCH/USD market short-position takers have to hold on firmly to their positions around the $300 alongside the 14-day SMA indicator. However, a break of the value line to the upside will be to retest resistance around a higher point of the 50-day SMA indicator before returning into a downward trend to re-satisfy the bearish trading cycle afterward.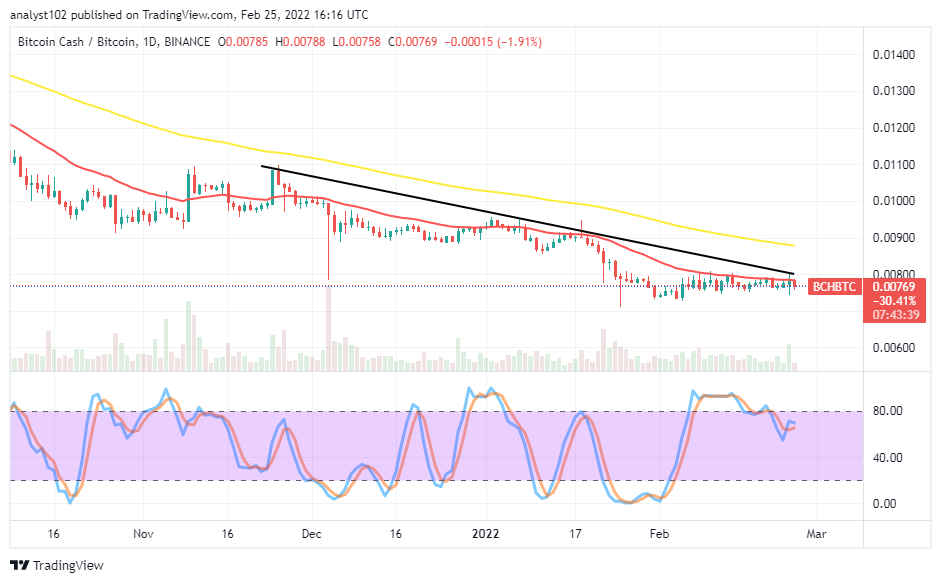
BCH/BTC Price Analysis
In comparison, Bitcoin Cash’s trending capability still features a losing nature against Bitcoin. The cryptocurrency pair trade keeps featuring in a low-trading outlook. The 50-day SMA indicator is above the 14-day SMA indicator. The bearish trend line drew closely above the smaller SMA. The Stochastic Oscillators have conjoined their lines, seemingly consolidating southbound from the overbought region toward lower range lines. The formation of candlesticks signifies the base crypto is less in reducing against the flagship counter crypto.
Note: Cryptosignals.org is not a financial advisor. Do your research before investing your funds in any financial asset or presented product or event. We are not responsible for your investing results.
You can purchase Lucky Block here. Buy LBlock: