$SPONGE (SPONGE/USD) Getting Reading for a Significant Price Surge
Estimated Reading Time: 3 minutes
Don’t invest unless you’re prepared to lose all the money you invest. This is a high-risk investment and you are unlikely to be protected if something goes wrong. Take 2 minutes to learn more

The SPONGE/USD market has experienced a prolonged period of sideways movement, consistently hovering around the $0.000045 price level. Despite numerous tests of lower price levels, the market has shown resilience, failing to break down towards it. This crypto signal hints at a potential accumulation phase underway. In such a scenario, market participants appear to be accumulating assets at the current price level, reflecting underlying strength or interest in the asset. This behavior suggests that investors are hesitant to sell at lower levels, possibly indicating a bullish sentiment or accumulation by astute investors.
Key Market Dynamics:
- Resistance Levels: $0.0010, $0.0011, and $0.0012.
- Support Levels: $0.000035, $0.000030, and $0.000025.
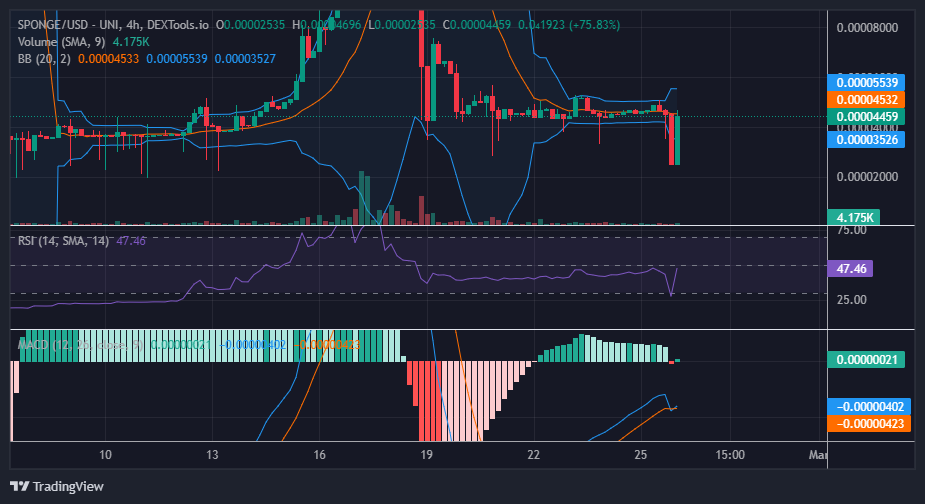
In-Depth Technical Analysis for $SPONGE (SPONGE/USD)
Both the Bollinger Bands and the Relative Strength Index have been indicating a stabilization in the market around the critical $0.000045 price level since February 21st. However, the Moving Average Convergence and Divergence (MACD), along with its histograms, have shown a gradual decrease in bearish strength since February 19th, with the two MACD lines attempting to cross above the zero level. Consequently, the signal derived from the MACD suggests a potential underlying bullish momentum, despite the current price channel indicating a stagnant market situation. Therefore, SPONGE/USD appears poised for a significant bullish price surge.
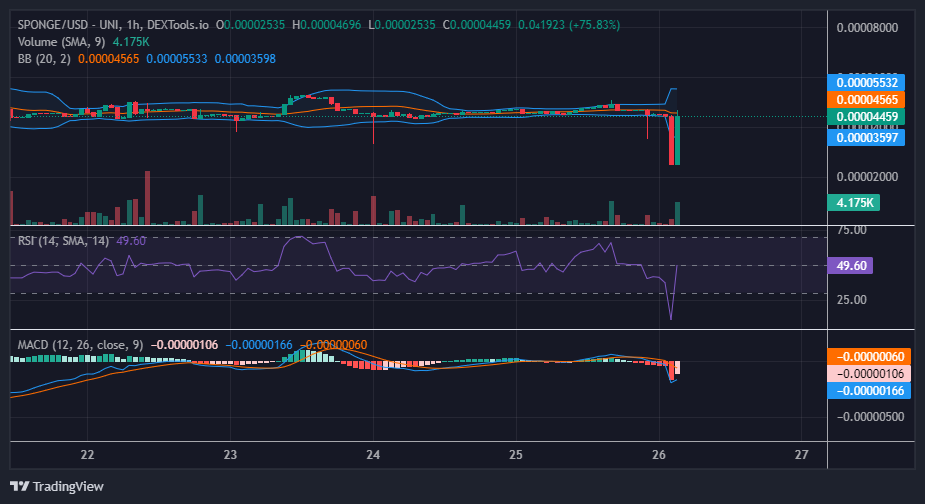
Insights from the 1-Hour Perspective:
From the perspective of the 1-hour chart, the market has remained resilient, firmly holding onto the midpoint, which signifies the equilibrium level. Analysis of the Relative Strength Index reveals a consistent pattern of price oscillation around the 50 level. This sustained price movement suggests the potential for a bullish trend to emerge. Traders are advised to remain vigilant and prepare to capitalize on potential market upswings.
At times, it’s beneficial to remain silent and absorb the damp.
Sometimes you just need to shut up and absorb the damp 🧽💦$SPONGE #Crypto #Staking #Bullish pic.twitter.com/iTehifHMZj
— $SPONGE (@spongeoneth) February 26, 2024
Invest in the hottest and best meme coin. Buy Sponge ($SPONGE) today!