Polygon (MATIC/USD) Price Stays Afloat, Finding Support
Estimated Reading Time: 3 minutes
Don’t invest unless you’re prepared to lose all the money you invest. This is a high-risk investment and you are unlikely to be protected if something goes wrong. Take 2 minutes to learn more
Polygon Price Prediction – September 3
Less active activities have started to crop up in the way that bears might have the tendency to push more significant lows in the trade worth of Polygon against the valuation of the US coin as the price stays afloat, finding support averagely above the line of $0.50.
If bulls are required to ease up on their efforts before restarting robust bounces, it means bears will still have a chance to slow the market’s movement to touch near the $0.50 support for proper swinging-high motions. However, every trading arrangement pattern has been set up to represent the best circumstance for purchasing back from dipping operations.
MATIC/USD Market
Key Levels:
Resistance levels: $0.70, $0.75, $0.80
Support levels: $0.50, $0.45, $0.40
MATIC/USD – Daily Chart
The MATIC/USD daily chart portrays the crypto market staying afloat, finding support around the level of $0.50.
The 14-day SMA trend line is at $0.591 underneath the $0.700 point of the 50-day SMA trend line. A space has surfaced between the indicators, confirming that a depression force is in place. The stochastic oscillators have crossed southbound from the line of 80 to places at 51.86 and 47.57.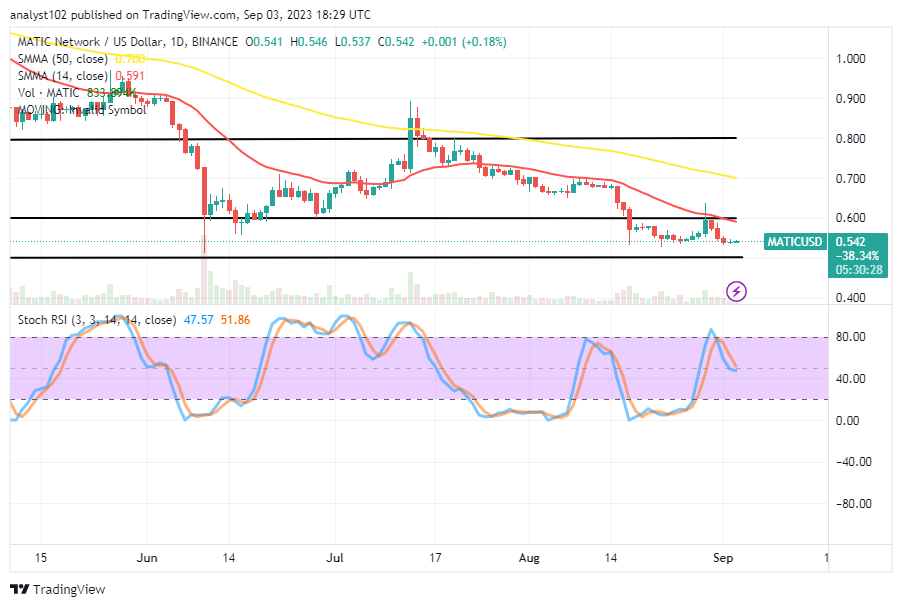
Will the MATIC/USD market continue to fluctuate and go below the key level of $0.50?
The probable factor that could cause sustainable decreases beyond the line of $0.50 isn’t likely to occur as long as the MATIC/USD market stays afloat, finding support around the point.
According to our analysis of the market’s northward technical trading posture, buyers should start making comebacks regardless of whether the price declines further against the crucial support line of $0.50. A promissory closing posture has been in place, suggesting a near-crossing signal back to the upside. An emergence of a bullish candlestick to denote more rises is expected to surface.
Even if it were necessary, the consolidation of the bearish momentum toward or near the $0.50 support level does not appear to last very long. It will be challenging for sellers to identify a concrete purchase entry order after that feeling manifests. Shorting would need to stop if there had to be an actual projected outcome.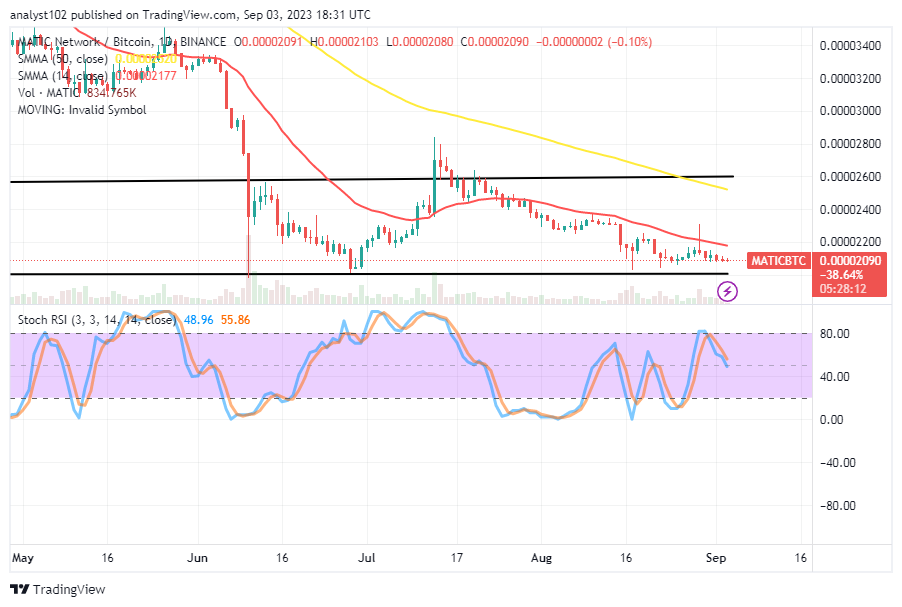
MATIC/BTC Price Analysis
In comparison, the Polygon market stays afloat against the trending stances of Bitcoin, finding support toward the horizontal line drawn below the smaller SMA.
Smaller bearish candlesticks have been seen to form with less vigor when the 14-day SMA indicator appears above them beneath the 50-day SMA signal. The stochastic oscillators are now situated between 55.86 and 48.96, slightly south of the line of 80. The current state of affairs suggests that the base cryptocurrency will take some time to rise against the counter-trading crypto asset. However, not much usually happens in terms of any potential decreases thereafter.
Note: Cryptosignals.org is not a financial advisor. Do your research before investing your funds in any financial asset or presented product or event. We are not responsible for your investing results.
You can purchase Lucky Block here. Buy LBLOCK