ZKsync (ZK/USDT) Sees a Prolonged Downtrend
Estimated Reading Time: 3 minutes
Don’t invest unless you’re prepared to lose all the money you invest. This is a high-risk investment and you are unlikely to be protected if something goes wrong. Take 2 minutes to learn more

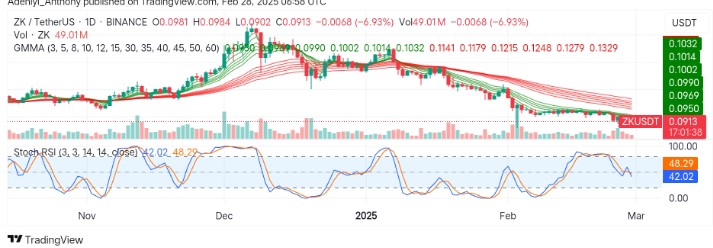
Zksync against the Tether has been on a downtrend since forming a local high around the beginning of the year in January 2025. However, the technical indicators signal more downward pressure as the Guppy Multiple Moving Averages (GMMAs) and the Stochastic RSI extend to the south.
Recently, Zksync has failed to break above $0.1100, triggering a selling pressure that has led to the current bearish condition. However, the price seems to be operating at a critical support level, but the overall bearish structure remains.
In the meantime, the pair may reclaim the $0.10000 resistance level, but the trend reversal requires a surge in buying activities as more sellers flood the market.
Currently, Zksync trades at $0.0913, with over 49 million traded volumes.
Technical Indicators
Major Resistance Levels: $01.1032, $0.1141, and $0.1215
Major Support Levels: $0.0900, $0.0850, and $0.0750
Zksync Technical Analysis
The market for Zksync against the Tether has been heading for the south after attaining a local height at the start of the year. However, the condition of the GMMAs suggests a strong sell-off in the near term as the traded volumes increase.
On the other hand, the Stochastic RSI indicates a mild-level oversold condition, with the lines pointing to the south. Though the lines may hint at a potential bounce, no confirmation has been seen yet.
To this end, if the pair fails to maintain the immediate support level, a move towards $0.0750 may be initiated. Conversely, a move above 0.1100 is needed for a reversal.
ZK/USDT Analysis: What’s Next?
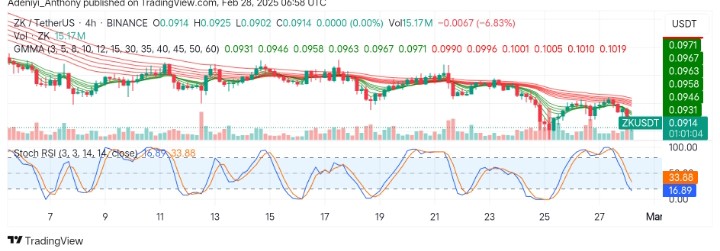
The analysis of ZK/USDT on a 4h chart shows that the pair is consistently making lower lows as the price heads to the south. However, the GMMAs suggest a strong bearish sentiment, as the volume increases with each dip in price, suggesting increasing bearish momentum.
On the other hand, the oscillator at the bottom of the chart indicates an oversold condition, with each line extending downwards. Though this suggests a chance for the bullish traders to re-enter the market, more confirmations are needed.
To this end, in the short-term, ZK may extend the bearish movement towards the $0.0750. This point may serve as a clear point of re-entry for the bullish traders.
You can purchase crypto coins here. Buy LBlock


