Ethereum (ETH/USDT) Riding the Bullish Wave Towards $4,000
Estimated Reading Time: 3 minutes
Don’t invest unless you’re prepared to lose all the money you invest. This is a high-risk investment and you are unlikely to be protected if something goes wrong. Take 2 minutes to learn more
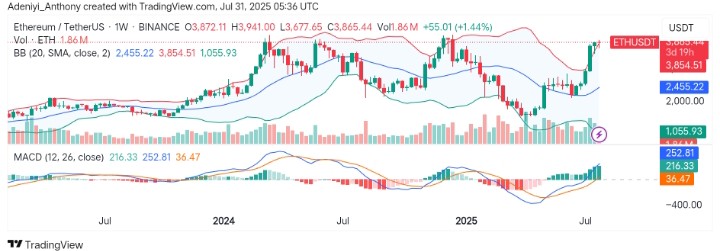
ETH/USDT Mid-term Analysis: Bullish
The market for Ethereum against Tether appears to be experiencing an upward momentum seen in the past few weeks; this is evident in the breakout above key levels of resistance. Also, the market has broken out of the range-bound consolidation phase that was seen earlier in the year.
However, in recent times, Ethereum appears to be forming new highs, indicating strong bullishness. As it stands, Ethereum’s price action is beginning to push toward an overbought condition on the weekly timeframe, which might signal a temporary pullback or consolidation before the next leg higher.
However, the MACD beneath the chart signals more bullish actions, but caution is warranted due to potential exhaustion near the upper segment of the Bollinger Bands.
Currently, Ethereum trades at $3,865.44, printing 1.86 million weekly traded volumes.
Technical Indicators
Major Resistance Levels: $3,872.11, $3,941.00, and $4,000.00
Major Support Levels: $3,500.00, $3,000.00, and $2,455.22
Ethereum Technical Analysis
On the weekly timeframe, the analysis of Ethereum against the Tether shows the price is testing the upper Bollinger Band. However, if the price continues in the same direction, more upside may be recorded, but the chances of increasing the likelihood of a pullback or consolidation would also increase.
From another angle, the MACD indicator shows significant bullish momentum with the blue line above the orange line, signaling a more upside trend. As it stands, the volume bars suggest strong buying activity, as seen in recent price movements. This is further confirmation of the strength behind the current rally. To this end, a decrease in volume with the price moving towards the $3,500 range could signal weakening momentum. However, the pair is on a bullish wave.
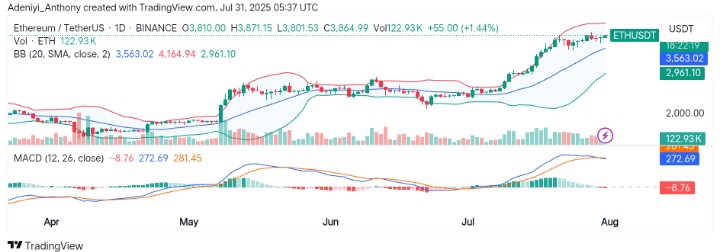
ETH/USDT Analysis: Gearing Up for More Gains
On the daily timeframe, the movement of ETH/USDT reveals further bullish action; the pair appears to be trading near the upper Bollinger Band, suggesting continued upward momentum.
Beneath the chart, the MACD remains positive, showing strong bullish momentum. Moreover, the MACD lines remain well separated, indicating sustained strength as volume increases to support the current rally towards $4,000.
You can purchase crypto coins here. Buy LBlock