SUIUSD Compresses Below Key Pivot as Bearish Momentum Strengthens
Estimated Reading Time: 3 minutes
Don’t invest unless you’re prepared to lose all the money you invest. This is a high-risk investment and you are unlikely to be protected if something goes wrong. Take 2 minutes to learn more

SUI/USD Price Prediction — January 20
SUI (SUIUSD) is trading around the $1.550 region after failing to reclaim the $1.560 pivot. Price action remains under pressure, with sellers keeping control and the market settling into a tight consolidation below resistance. The market suggests that momentum favoring the downside is still intact, and price is digesting recent losses rather than immediately reversing.
SUI/USD Market Key Levels
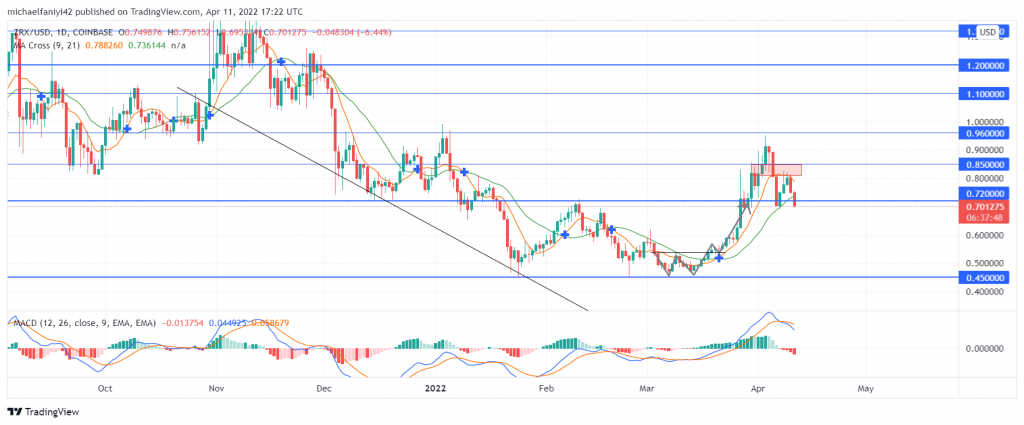
Resistance levels: $1.56, $3.70
Support levels: $1.27, $0.58

SUI/USD Long-Term Trend — Bearish (Daily Chart)
On the daily chart, SUI remains within a broader corrective phase, with price unable to sustain moves above intermediate resistance. The structure has been carving lower highs over recent sessions, and attempts to reclaim key levels have been met with selling pressure. While price is not in free-fall, the market lacks convincing upside momentum to suggest a trend reversal.
What is the Market Outlook for SUIUSD?
The Chande Momentum Oscillator is deep in negative territory, signaling prevailing bearish pressure, while MACD histogram readings remain mixed. This divergence suggests that downside momentum may be losing steam, but there is not yet enough evidence to indicate a shift into sustained buying interest.
SUIUSD is currently boxed between $1.270 support and $1.560 resistance, creating a clear equilibrium range. As long as price remains below the $1.560 pivot, the broader structure favors continuation of the corrective phase and potential re-tests of lower support levels.
A decisive breakout and daily acceptance above $1.560 would signal improving demand and could open the door toward $1.810 and higher. Such a move would strengthen bullish crypto signals and suggest that recent consolidation is resolving to the upside.

SUI/USD Short-Term Trend — Bearish (4-Hour Chart)
On the 4-hour chart, SUIUSD is displaying clear short-term weakness. Price action is compressing within a tight band below resistance, with multiple failed attempts to reclaim higher ground. This structure suggests continued range behavior with a bearish tilt until price either breaks above $1.560 price zone with conviction.
SUI/USD Market Statistics
Current Price: $1.550
Market Capitalization: $1.03B
24H Trading Volume: $350.00M
Place winning SUI trades with us. Get SUI here