Raydium (RAY/USD) Rebounds Sharply Below $5.00, Sparks Bullish Momentum
Estimated Reading Time: 3 minutes
Don’t invest unless you’re prepared to lose all the money you invest. This is a high-risk investment and you are unlikely to be protected if something goes wrong. Take 2 minutes to learn more
Looking at the Raydium market from a wider viewpoint, the market appears to be in a consolidation phase, with prices fluctuating around the $5.00 level. Although this period of consolidation is ongoing, there has been a noticeable formation of higher lows around the $4.50 mark, which is a significant improvement from the previous support level of $4.20. Today, the market surged with impressive bullish momentum, claiming the top position. However, the $5.00 level could present a strong resistance, despite the clear bullish sentiment observed in today’s trading session.
Raydium Market Data
- RAY/USD Price Now: $4.989
- RAY/USD Market Cap: $1.4 billion
- RAY/USD Circulating Supply: 289.9 million RAY
- RAY/USD Total Supply: 554.9 million RAY
- RAY/USD CoinMarketCap Ranking: #71
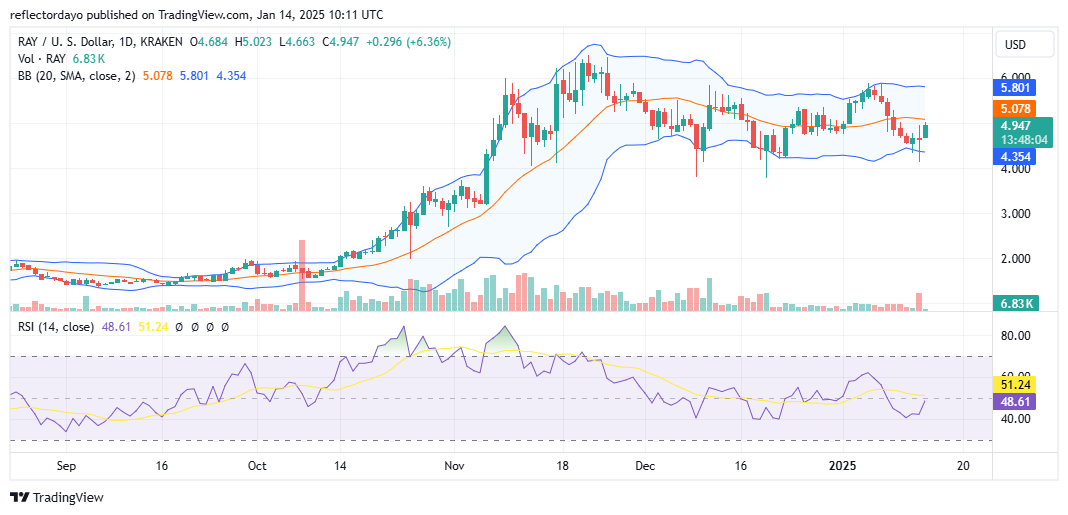
Key Levels
- Resistance: $5.00, $5.50, and $6.00
- Support: $4.50, $4.00, and $3.50.
The Raydium Market Through the Lens of Indicators
Although today’s market is largely driven by bullish sentiment, with Raydium‘s trading activity positioning it as a top mover of the day, it’s important to note that the ongoing bullish momentum, while visible on the chart, is accompanied by a relatively small histogram. This diminishes the credibility of the bullish trend, especially as the market may encounter significant resistance at the $5.00 level. The bullish candlestick pattern, combined with the small trading volume histogram, suggests that only a limited number of market participants may be fueling the current upward movement. While this crypto signal raises concerns about the strength of the current price action, it could also indicate that some investors are accumulating positions in anticipation of a more substantial upside. A break above the $5.00 resistance could trigger further bullish momentum, potentially driving the market higher.
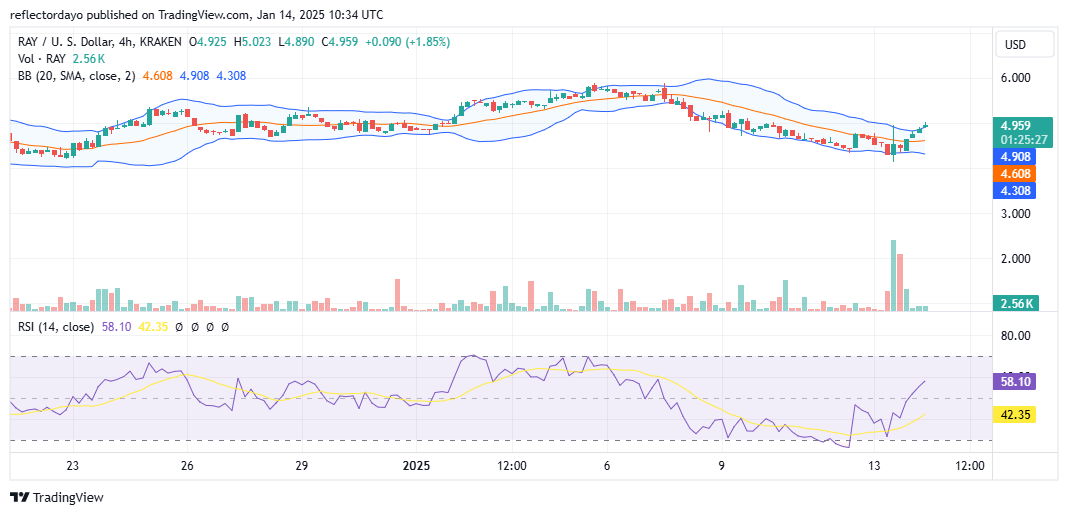
RAY/USD Price Prediction: 4-Hour Chart Analysis
Upon examining the 4-hour chart, we observed that yesterday saw a significant surge in trading volume, as indicated by the height of the volume histograms. However, this surge was essentially a battle between bullish and bearish forces, preventing the market from making any significant progress in either direction. Today, the market displayed upward movement, but as the price approached the critical $5.00 level, we noted the emergence of bearish momentum, with traders beginning to take profits. Another noteworthy observation is the growing balance between bearish and bullish forces, as reflected in the smaller histograms and candlesticks near the $5.00 level, indicating a potential equilibrium in market sentiment.