JITO (JTO/USD) Bounces Back From Four-Month Lows
Estimated Reading Time: 3 minutes
Don’t invest unless you’re prepared to lose all the money you invest. This is a high-risk investment and you are unlikely to be protected if something goes wrong. Take 2 minutes to learn more

The critical $2.5 price level has served as a significant support zone in the JITO market for approximately four months, consistently holding the price above itself and the $3.00 level. In December, the bearish momentum noticeably slowed as the price approached this key level, even triggering a rebound. This price behavior highlights the strong bullish bias prevalent around this area.
However, despite this resilience, today’s trading activities reveal that the market has broken below this critical support level amid significant downward volatility in the broader crypto market. This breakdown may present an opportunity for investors to buy the dip and potentially facilitate a rebound.
Jito Market Data
- JTO/USD Price Now: $2.27
- JTO/USD Market Cap: $642 million
- JTO/USD Circulating Supply:281.7 million JTO
- JTO/USD Total Supply: 1 billion JTO
- JTO/USD CoinMarketCap Ranking: #120
Key Levels
- Resistance: $3.00, $3.30, and $3.50
- Support: $2.00, $1.80, and $1.50.
The Jito Market Through the Lens of Indicators
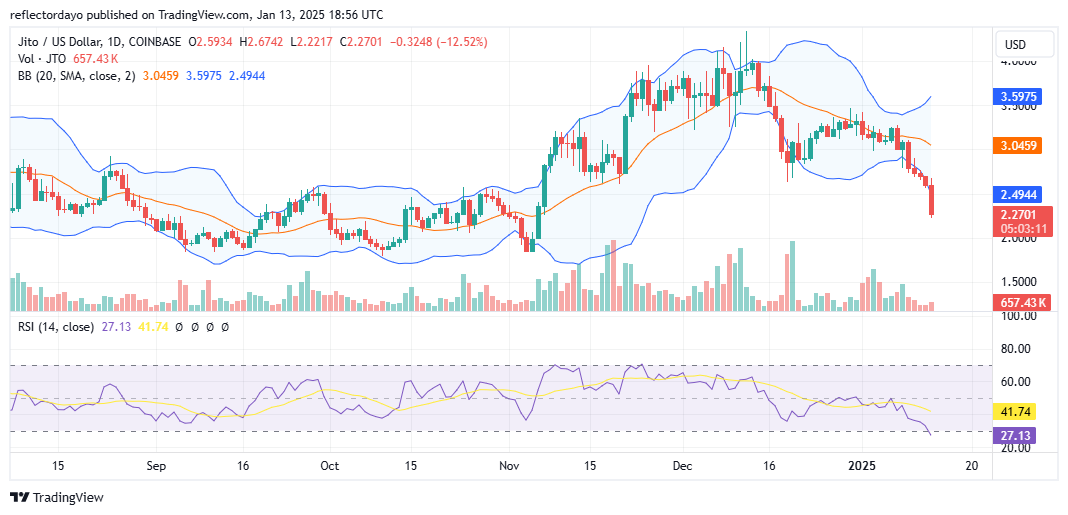
Since January 9, when the market broke below the critical support level at $3.00, downward volatility appears to have been triggered. This is evident in the expansion of the Bollinger Bands, signaling increased market volatility as the bearish crypto price action drives the market lower.
Examining the candlestick patterns, January 9 reflected strong selling activity, which set the tone for subsequent bearish moves. Similarly, today’s trading activity, January 13, has also shown significant selling pressure, causing the price to break below the critical $2.50 support level—a key bullish stronghold.
At this stage, there are signs that the bearish momentum may be nearing its climax, despite the general downward trend in the broader cryptocurrency market. With the market currently trading at $2.27, this level could present a compelling opportunity for Jito investors to buy the dip. Indicators such as the Bollinger Bands and the Relative Strength Index (RSI) are signaling oversold conditions, suggesting a potential market reversal.
As selling pressure begins to subside, it may pave the way for renewed buying interest, potentially triggering a strong upward swing. Historically, intense selling action often precedes robust buying activity, which could lead to a significant market recovery.
JTO/USD Price Prediction: 4-Hour Chart Analysis
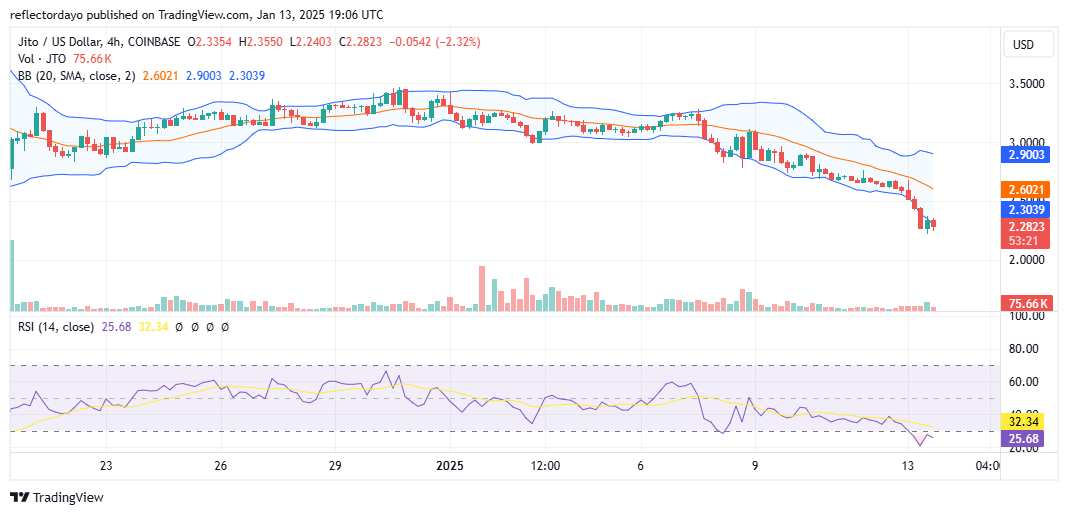
From the perspective of the 4-hour chart, the market remains under strong selling pressure, with the Bollinger Bands indicator reflecting a downward-trending price channel. However, a lower support level appears to be forming around $2.27. Bullish activity at this level has successfully rejected bearish pressure over the past two to three trading sessions.
This emerging support suggests that buyers may hold their ground here, potentially resisting the prevailing bearish momentum. If this support level holds, it could pave the way for a strong bullish price move.
The market appears primed for a potential bounce, as the Relative Strength Index (RSI) currently sits below the 30 level, signaling oversold conditions and hinting at the possibility of a reversal.