Ripple (XRP) Retraces to $1.08 Support, May Resume Upward Move
Estimated Reading Time: 2 minutes
Don’t invest unless you’re prepared to lose all the money you invest. This is a high-risk investment and you are unlikely to be protected if something goes wrong. Take 2 minutes to learn more
Ripple (XRP) Long-Term Analysis: Bullish
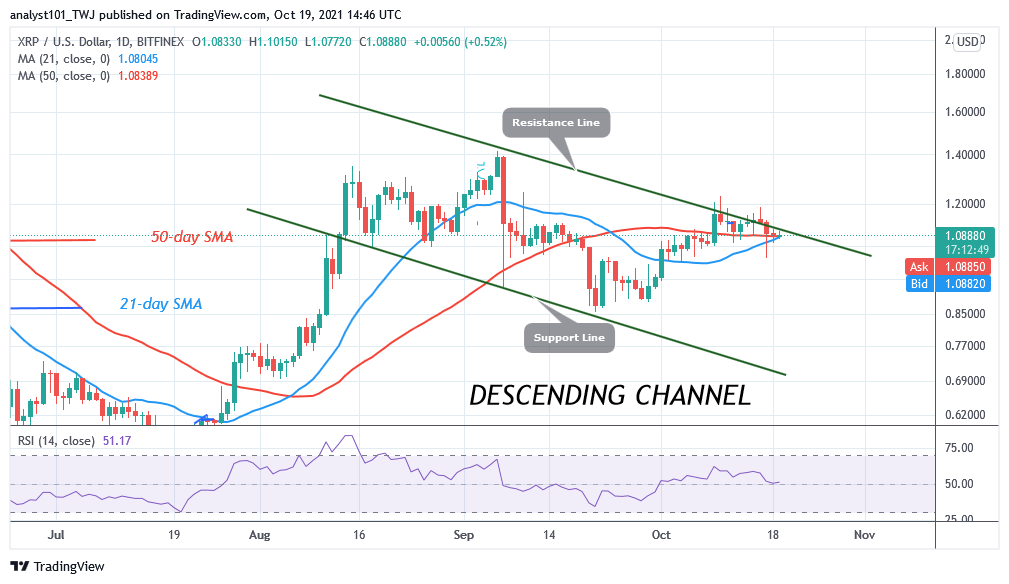
Ripple’s (XRP) price has been in a downward move after rejection from the $1.20 resistance. XRP price is hovering above the 50-day SMA. The bears are attempting to break below the moving averages. A break below the moving averages will mean a further downward movement of the altcoin. The cryptocurrency will resume upward if the support holds. On the upside, if price breaks above the resistance, the market will rally to $1.41.
Ripple (XRP) Indicator Analysis
Meanwhile, Ripple is at level 50 of the Relative Strength Index period 14. This implies that there is a balance between supply and demand. The crypto’s price is still above the moving averages which suggests a further upward movement of an altcoin.XRP is below the 60% area of the daily stochastic. The bearish momentum has subsided as the market consolidates above the $1.08 support.
Technical indicators:
Major Resistance Levels – $2.00, $2.50, $3.00
Major Support Levels – $1.50, $1.00, $0.50
What Is the Next Direction for Ripple (XRP)
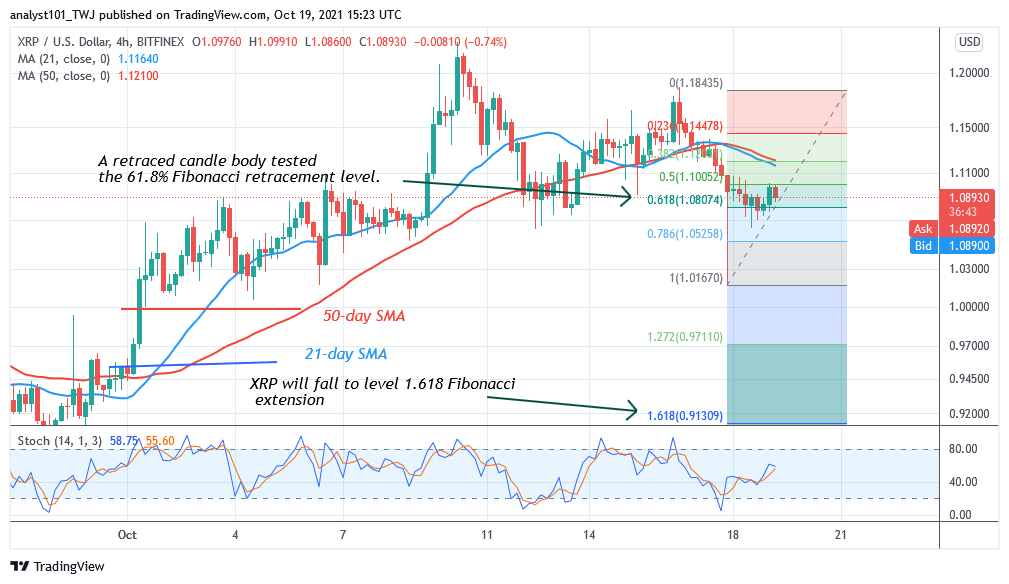
On the 4- hour chart, Ripple has been consolidating above the $1.08 support for the past three days. The downtrend will resume if the support is breached. However, the support has not been broken since October 3. Meanwhile, on October 17 downtrend; a retraced candle body tested the 61.8% Fibonacci retracement level. The retracement indicates that XRP price will fall to level 1.618 Fibonacci extension or $0.91.
You can purchase crypto coins here. Buy Tokens
Note: Cryptosignals.org is not a financial advisor. Do your research before investing your funds in any financial asset or presented product or event. We are not responsible for your investing result