Ripple Declines as Bears Attempt to Breach the $0.92 Support
Estimated Reading Time: 2 minutes
Don’t invest unless you’re prepared to lose all the money you invest. This is a high-risk investment and you are unlikely to be protected if something goes wrong. Take 2 minutes to learn more
![]()
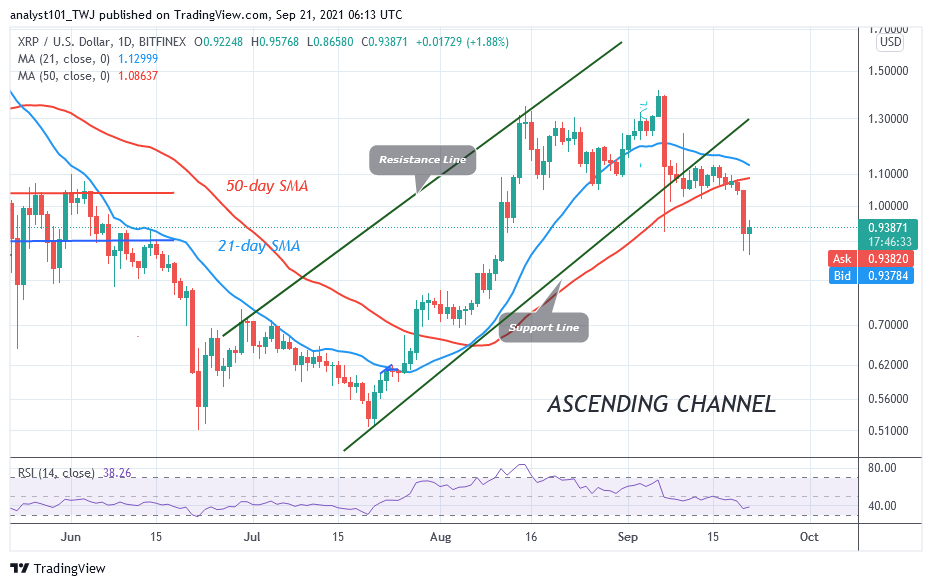
Ripple (XRP) Long-Term Analysis: Bearish
Ripple’s (XRP) price declines to $0.87 low after consolidating above the 50-day SMA for two weeks. XRP/USD is trading in the bearish trend zone. The altcoin is capable of falling on the downside. For the past 24 hours, the XRP price has been retesting the previous low at $0.92 to break below it. On the downside, if the bears are successful, XRP will further decline to $0, 65 low. On the other hand, if the current support holds, XRP will rise to retest the initial resistance at level $1.10. In the meantime, XRP is making a downward move. A break below the current support will accelerate the selling pressure.
Ripple (XRP) Indicator Analysis
XRP/USD is at level 35 of the Relative Strength Index period 14. It indicates that the crypto is in the downtrend zone and it is approaching the oversold region of the market. Presently, the XRP price is below the moving averages suggesting a further downward move.XRP is below the 50% range of the daily stochastic. The altcoin is in a bearish momentum.
Technical indicators:
Major Resistance Levels – $2.00, $2.50, $3.00
Major Support Levels – $1.50, $1.00, $0.50
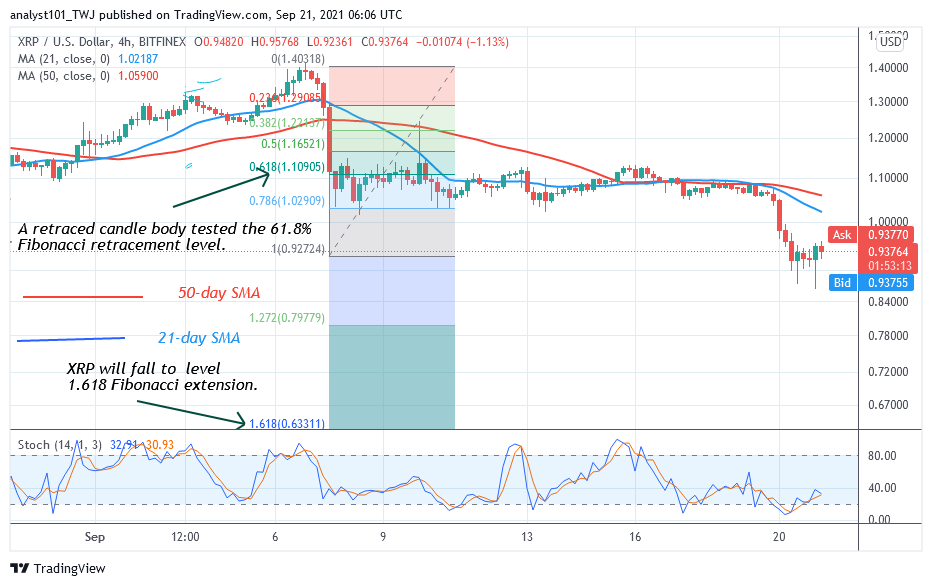
What Is the Next Direction for Ripple (XRP)
For the past 24 hours, Ripple has been fluctuating above the $0.92 support. The bears have taken control of price as they attempt to break below the current support. Meanwhile, on September 7 downtrend; a retraced candle body tested the 61.8% Fibonacci retracement level. The retracement indicates that XRP price will fall to the low of level 1.618 Fibonacci extension or level $0.63.
You can purchase crypto coins here. Buy Tokens
Note: Cryptosignals.org is not a financial advisor. Do your research before investing your funds in any financial asset or presented product or event. We are not responsible for your investing results