Polkadot Moves Upward but May Face Rejection at $7.11
Estimated Reading Time: 2 minutes
Don’t invest unless you’re prepared to lose all the money you invest. This is a high-risk investment and you are unlikely to be protected if something goes wrong. Take 2 minutes to learn more
Polkadot (DOT) Long-Term Analysis: Bullish
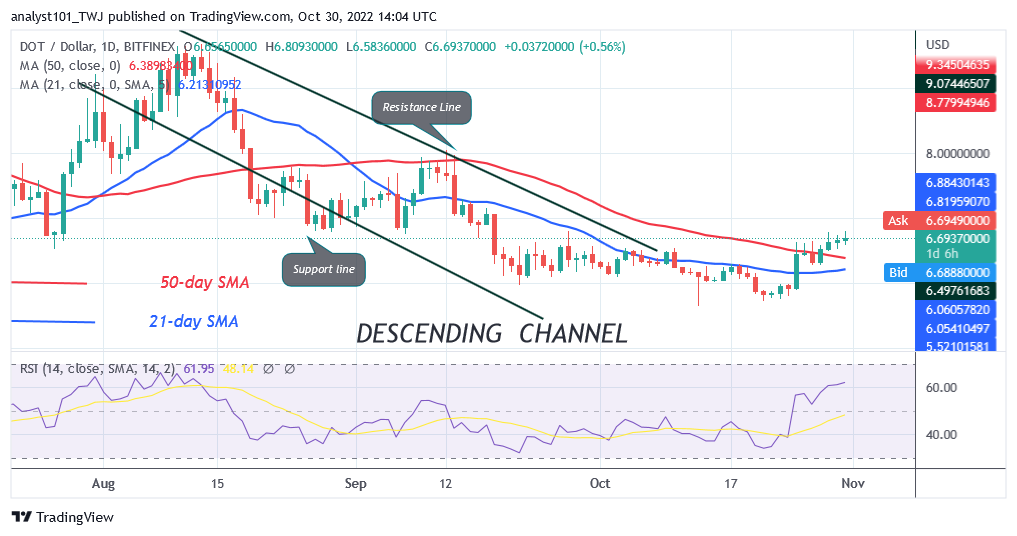
Polkadot’s (DOT) price is in the bullish trend zone but may face rejection at $7.11. The altcoin is trading above the moving average lines but has reached the overbought region of the market. The price action shows small body indecisive candlesticks called Doji. These candlesticks indicate indecision between buyers and sellers about the direction of the market. DOT price is trading at $6.65 at the time of writing.
Polkadot (DOT) Indicator Analysis
The current upward move has pushed DOT price to level 61 of the Relative Strength Index for period 14. The moving average lines are below the price bars of the cryptocurrency, signaling further upward movement of the asset. The overbought area of the market is getting closer to the cryptocurrency. DOT is above the daily Stochastic’s 80% range. It is trading in the overbought region. The SMA lines for the 21-day and 50-day periods are pointing downward, signaling a fall.
Technical indicators:
Major Resistance Levels – $10, $12, $14
Major Support Levels – $8, $6, $4
What Is the Next Direction for Polkadot (DOT)?
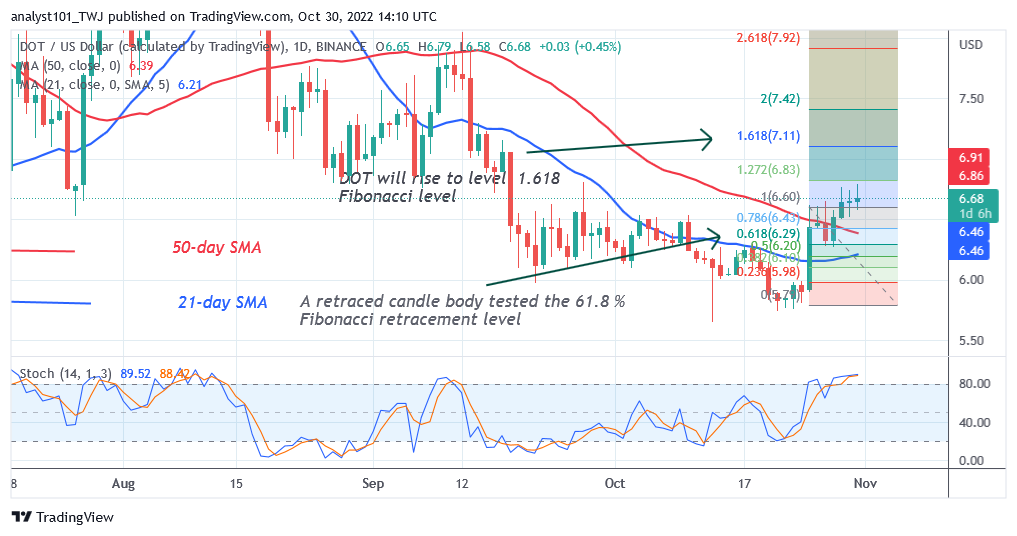
Polkadot moves into the overbought region but may face rejection at $7.11. During the October 25 uptrend, a candle body tested the 61.8% Fibonacci retracement level. The retracement will cause the DOT price to rise to level 1.618 Fibonacci extension or $7.11.
You can purchase crypto coins here. Buy LBLOCK
Note: Cryptosignals.org is not a 1a financial advisor. Do your research before investing your funds in any financial asset or presented product or event. We are not responsible for your investing results