Quant (QNT/USD) Bulls Charge Ahead Amidst Market Volatility
Estimated Reading Time: 3 minutes
Don’t invest unless you’re prepared to lose all the money you invest. This is a high-risk investment and you are unlikely to be protected if something goes wrong. Take 2 minutes to learn more
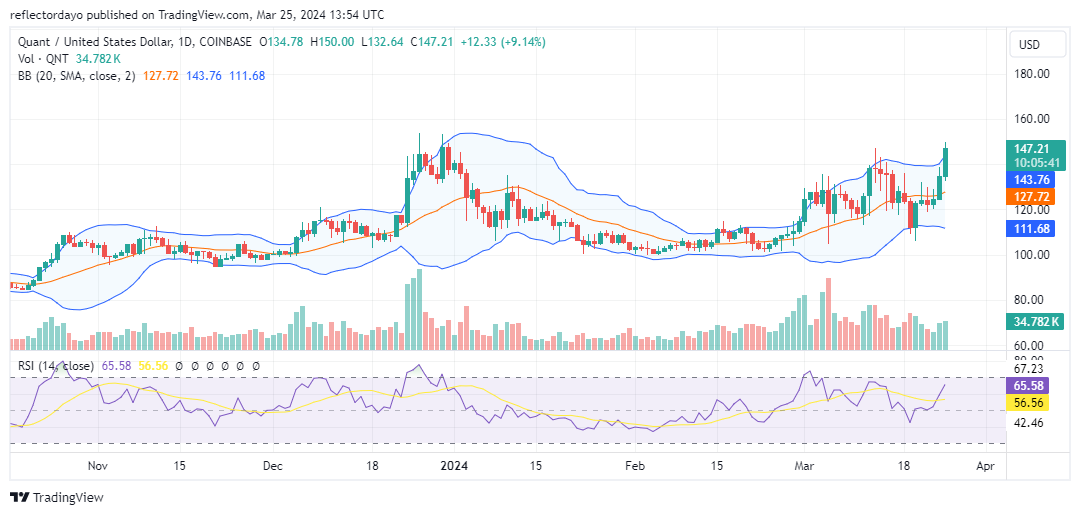
Over the past few weeks, particularly since the onset of March, the Quant market has exhibited volatility, with prices surging above $120. Despite this volatility, prices have largely fluctuated within the range of $120 to $140. A robust resistance barrier has been identified around the $140 price mark. On March 13, the bullish market encountered resistance at the $140 level, resulting in a retracement to the support level at $111. Bullish intervention around $111 established a broad price channel, signaling ongoing volatility within the market.
Quant Market Data
- QNT/USD Price Now: $147.24
- QNT/USD Market Cap: $1.7 billion
- QNT/USD Circulating Supply: 12 million
- QNT/USD Total Supply: 14.9 million
- QNT/USD CoinMarketCap Ranking: #65
Key Levels
- Resistance: $150, $160, and $170.
- Support: $127, $111, and $100.
Quant Market Analysis: The Indicators’ Point of View
In today’s trading session, the market has shown a significant bias towards bullish activity, surpassing the $140 price threshold and consequently elevating volatility levels. Furthermore, the Relative Strength Index, registering a bullish momentum of approximately 65, underscores traders’ current inclination towards buying. The breach of the critical $140 price level likely incentivized additional participation in the upward trend. However, the bullish market now faces resistance at $150. Should bulls encounter resistance at $150 and fail to surpass it, securing support in the vicinity, particularly at the $140 mark, will exert pressure on bearish positions at $150. This scenario could potentially lead to a breakout above $150.
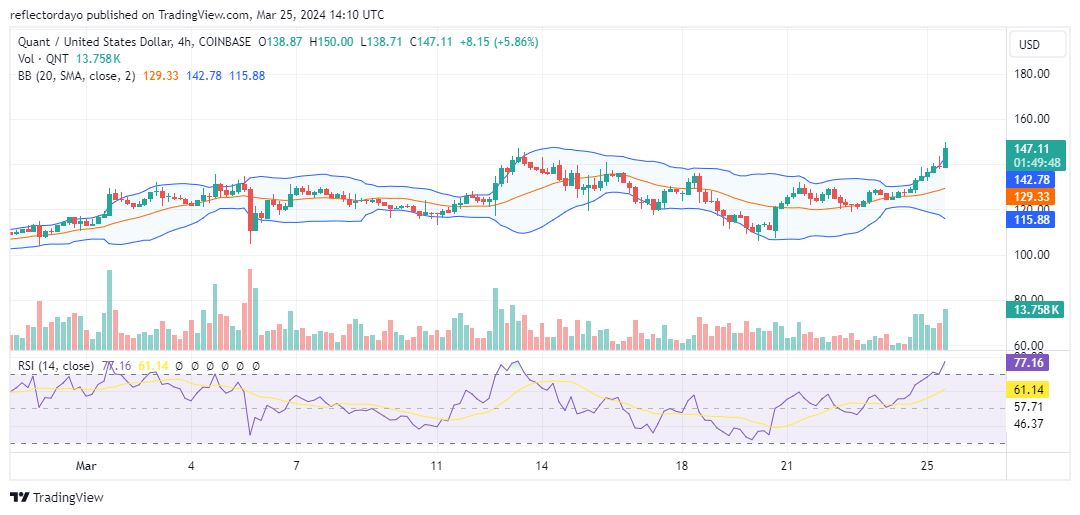
QNT/USD 4-Hour Chart Outlook
Analyzing the market through the lens of the 4-hour chart, it appears that traders have potentially identified the $140 price level as a key support level. This observation stems from the previous 4-hour session, where the market remained anchored around the $140 threshold throughout the entirety of the session, closing at the same level as the opening. This stagnation was followed by a robust bullish price movement in the current session. Despite encountering bearish resistance at present, there is optimism (according to this crypto signal) that bulls will discover a stronger support level to sustain the upward trend.